$ADA is currently trading at $0.188, the kind that's been quietly holding the price up for a few days straight. Bounce off it again and there's real room to climb. Lose it, though, and the fl
$ADA is currently trading at $0.188, the kind that's been quietly holding the price up for a few days straight.
Bounce off it again and there's real room to climb. Lose it, though, and the floor underneath gets a lot less friendly.
What tips the scale? Whether buyers show up at this exact line one more time.
This cardano price prediction is built around that single question rather than assuming either outcome.
Live Market Data
MetricValue
Price$0.18824h Range$0.1864 to $0.1976Market Cap$7.021BFDV$8.459B24h Volume$406.175MCirculating Supply37.347B ADATotal Supply45B ADAMax Supply45B ADASource: $ADA Market Cap Data Taken From Coingecko, data as of Aug 06, 2026. Figures may vary slightly across other tracking websites.
Liquidation Heatmap
The liquidation heatmap for ADA leans long-heavy but is not as lopsided as some other tokens right now. In the past hour, just $1.85K got liquidated, mostly longs. 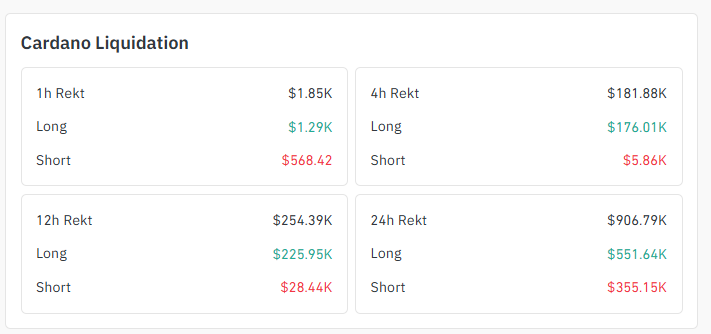
Source: Liquidation Data Taken From Coinglass.
Four hours brought $181.88K, with longs eating $176.01K of that total.
Over 12 hours it's $254.39K, and the full 24-hour window shows $906.79K wiped out, split $551.64K longs against $355.15K shorts.
Shorts are actually taking real damage here too, unlike some setups where they barely register.
That balance suggests the market isn't fully convinced in either direction yet.
Exchange Volume
Exchange volume is dominated by Binance futures at $199.86M, nearly double the next closest venue. 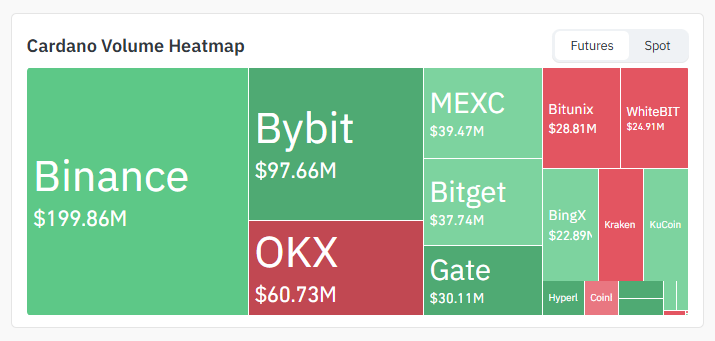
Source: Volume Heatmap Data Taken From Coinglass.
Bybit follows at $97.66M, then OKX at $60.73M. MEXC, Bitget, and Gate sit in the $30M to $40M range, while smaller platforms like Bitunix, WhiteBIT, and BingX contribute the rest.
This heavy Binance concentration means moves there often lead the broader market's reaction.
On-Chain Whale Activity
Large holders added more than 240 million ADA to their positions over the past five days, a meaningful accumulation window. 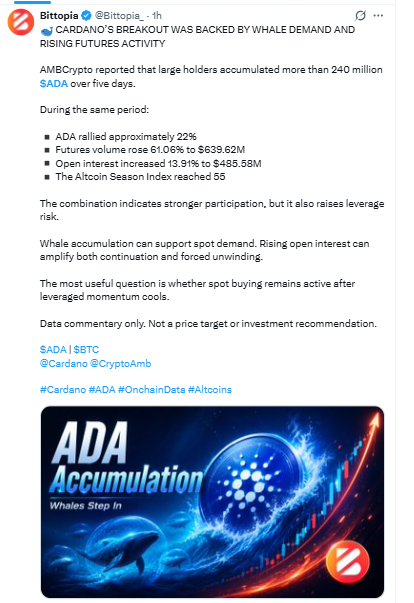
Source: Data Taken From @Bittopia, on X Account.
During that same stretch, ADA rallied roughly 22%, futures volume climbed over 61% to $639.62M, and open interest rose nearly 14% to $485.58M.
The Altcoin Season Index also touched 55.
Whale buying tends to support spot demand directly, but rising open interest alongside it means forced unwinding risk grows too if momentum stalls.
Key Takeaways
$0.188 and sliding slightly, that's where ADA sits, right on a rising trendline that's held for days
Clear $0.1994 with volume and this Cardano ADA price prediction opens toward $0.2068, then further out toward $0.2468
Large holders scooped up over 240 million ADA in five days, no small number by any measure
Long liquidations dominate again, with $551.64K wiped out in 24 hours against $355.15K on the short side
Open interest jumped nearly 14% alongside the recent rally, which cuts both ways for what comes next
Technical Analysis
1-Hour Chart Analysis of $ADA
The 1H chart Analysis. The price is sitting almost exactly on a rising trendline that's caught two prior bounces already, a third test happening right now. 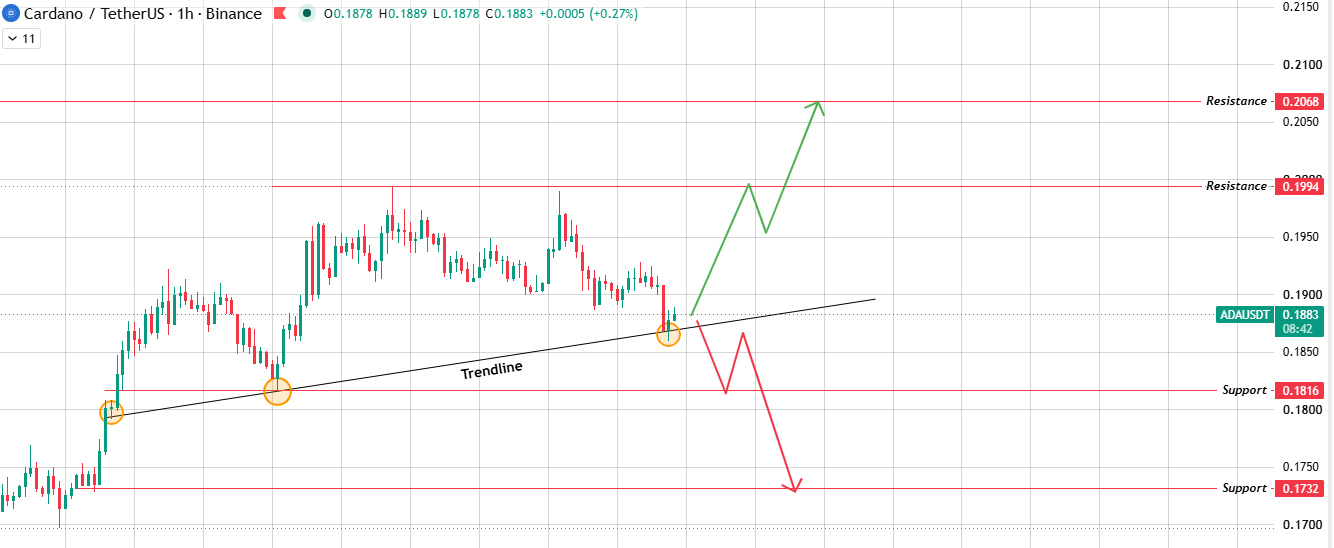
Source: Chart Taken From TradingView.
Hold it, and $0.1994 comes into range first, then $0.2068 if buyers keep pushing.
Break it instead and $0.1816 becomes the next stop, with $0.1732 waiting underneath that.
Cardano Ada Daily Chart Analysis
Zoom out to the daily, and ADA is riding an ascending channeland has been in it for a while now, currently testing the lower boundary after a pullback from the highs. 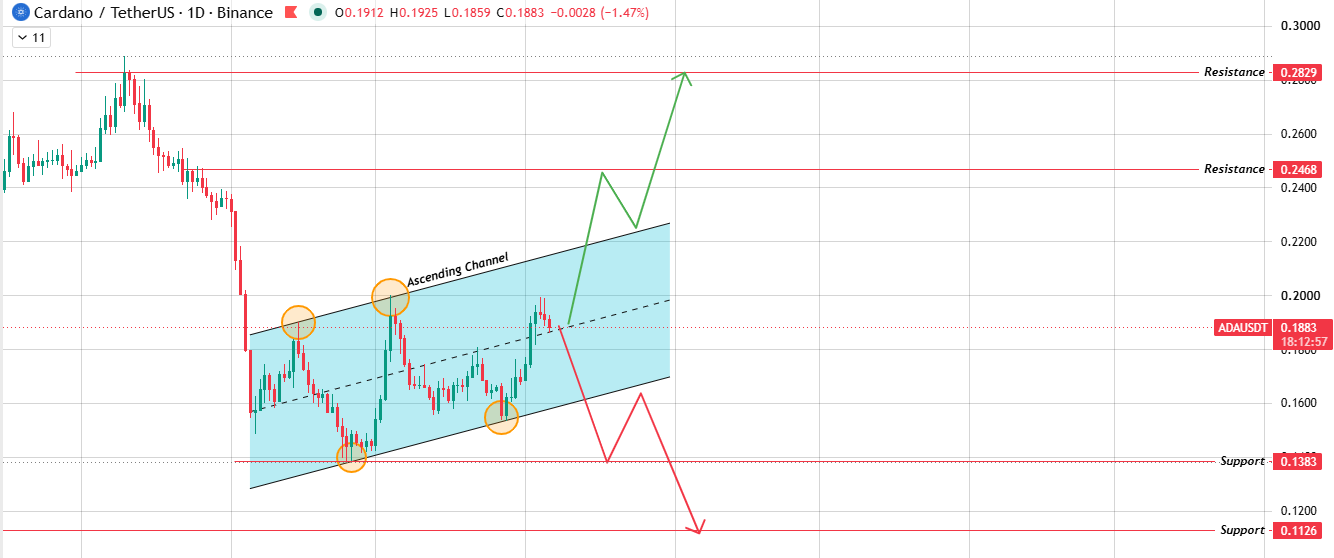
Source: Chart Taken From TradingView.
This is really where any credible cardano ada price prediction has to focus.
A bounce off channel support with volume opens the door toward $0.2468, and if momentum really carries, $0.2829 sits further out as the stretch target.
Fail to hold this channel floor, and the price likely drops to $0.1383, with $0.1126 as the deeper level below that.
Bull, Base, and Bear Cases
ScenarioTriggerTarget
BullBullish breakout above
$0.1994 with volume confirmation
$0.2468BaseRange-bound between
$0.1816 and
$0.1994Sideways ChopBearBearish breakdown below
$0.1816 support zone
$0.1383Invalidation: the bull case falls apart if ADA keeps getting rejected at $0.1994 on repeated attempts without clearing it. The bear case is off the table if buyers defend the rising trendline near $0.1878 and hold it for a bounce.
Expert Opinion
What are analysts making of the whale accumulation? Stronger participation, mostly. But nobody's ignoring the leverage buildup sitting right underneath it.
The real question floating around right now: does spot buying stick around once this leveraged momentum runs out of steam?
If it doesn't, the whole rally starts looking like it was built on borrowed conviction rather than genuine demand.
Risks
This Cardano ADA price prediction comes with a few strings attached. Open interest climbing means a sharp move in either direction could trigger fast unwinding; no way around that.
BTC dominance shifts are another wildcard, capable of dragging ADA down even if the local trendline holds up fine.
And then there's ETH correlation, still very much in play since ADA tends to move with broader altcoin sentiment more than it charts its own course.
Glossary
Ascending Channel:Two parallel trendlines climbing together, price travelling between them. Grinds higher, not straight up.
Descending Channel: Same idea, flipped. Price slides lower between two parallel lines until it finally breaks free one way or the other.
Liquidation Heatmap: Shows exactly where leveraged traders got force-closed and how much cash disappeared when it happened.
Support Zone: Think of it as a floor. An area where buyers have shown up before and probably will again if price gets there.
Price Target: The level a pattern points toward, assuming everything plays out the way the setup suggests it should.
Disclaimer: This article is for informational purposes only and does not constitute financial advice. Cryptocurrency markets are highly volatile. All price levels referenced are derived directly from TradingView chart data, and liquidation figures come from Coinglass. Always conduct independent research before making investment decisions.