LINK cleared leveraged long positions near 9.87–9.91 before recovering above $10 and sweeping short liquidity around $10.05. Liquidity concentrations at $10.28 and $10.38 could attract LINK i
- LINK cleared leveraged long positions near 9.87–9.91 before recovering above $10 and sweeping short liquidity around $10.05.
- Liquidity concentrations at $10.28 and $10.38 could attract LINK if buyers overcome intermediate resistance around $10.12 and $10.19.
- A decisive breakdown below $9.85 could expose the $9.66 liquidation pool, threatening LINK's developing recovery and short-term bullish structure.
Chainlink price reveals a developing recovery after aggressive liquidity sweeps, with concentrated leveraged positions creating competing price targets across the market.
LINK Sweeps Liquidity Before Reclaiming $10
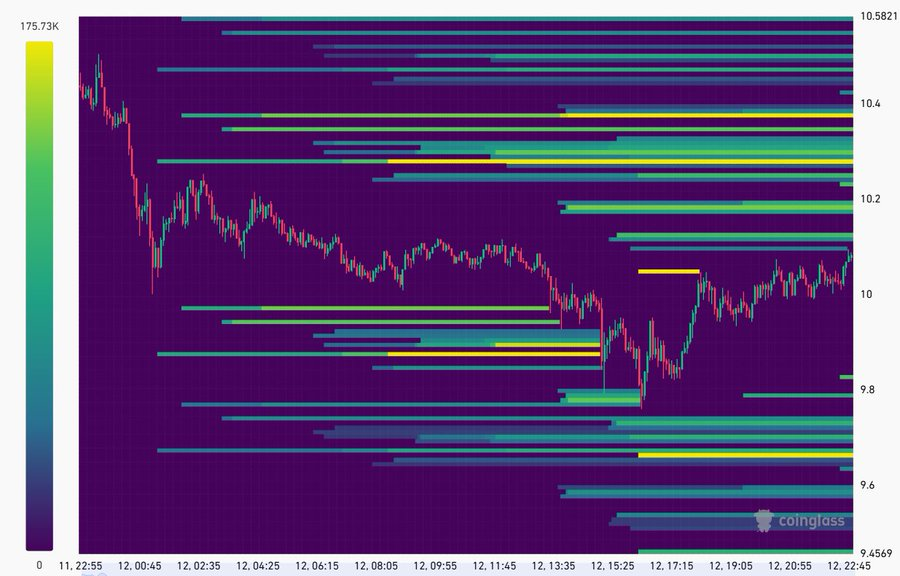
Giannis Andreou identifies an interesting development in Chainlink's latest trading structure. His analysis shows LINK clearing leveraged positions on both sides before recovering. The initial sell-off targeted long liquidation clusters between $9.87 and $9.91.
Source:
X
Selling pressure subsequently pushed the token toward $9.76 before buyers intervened. That reaction triggered a recovery, carrying LINK back above $9.80. The rebound eventually cleared short positions concentrated around the $10.05 region.
This sequence effectively removed two important concentrations of leveraged market positions. However, clearing liquidity does not automatically establish a sustained directional trend. The subsequent price reaction remains important for determining market control.
The token's ability to recover above $10 provides an encouraging technical development. Andreou also observes higher lows following the initial downward movement. Nevertheless, buyers must maintain that structure to preserve upward momentum.
Overhead Liquidity Places $10.38 in Focus
The heatmap identifies substantial short liquidation concentrations above LINK's current trading range. The first major cluster appears around $10.28, followed by another near $10.38. These bright horizontal bands indicate areas containing considerable leveraged short exposure.
Andreou identifies $10.12 and $10.19 as immediate resistance checkpoints. Clearing both levels could position LINK for another attempt toward $10.28. A successful move beyond that concentration could expose the higher $10.38 target.

The distinction between these levels matters when assessing the potential recovery. Intermediate resistance could interrupt upward movement before larger liquidity clusters become accessible. Consequently, buyers need sustained participation rather than isolated upward price movements.
The $10.38 region represents the higher potential destination in Andreou's scenario. Short liquidations there could contribute additional buying pressure during an upward move. However, the presence of liquidity alone cannot guarantee that price reaches this level.
$9.85 Breakdown Could Expose $9.66
The downside structure remains relevant despite the recent recovery above $10. Andreou identifies $9.85 as the critical threshold during renewed selling pressure. Losing that level decisively could weaken the developing higher-low formation.
Below this threshold, the heatmap reveals a substantial long liquidation concentration around $9.66. This pool represents another potential destination if selling pressure accelerates. A downward move could therefore reverse much of the recent recovery.
The earlier wick toward $9.76 provides additional context for this downside scenario. Although buyers defended that region previously, another test could produce different results. Continued selling would place renewed attention on the lower liquidity concentration.
The supplied market snapshot records LINK trading around $9.98, down approximately 0.2%. Its market capitalization stands near $7.46 billion, with daily trading volume increasing 37.43%. These figures provide context for the trading session but do not establish directional confirmation.
For now, the immediate technical outlook depends on several closely positioned levels. A move above $10.12 and $10.19 could reopen the 10.28–10.38 range. Conversely, a decisive breakdown below $9.85 would expose $9.66. The next liquidity sweep will determine whether buyers extend recovery or sellers regain control.