Chainlink is one of the most talked about names in crypto right now, and for good reason. It's a decentralized oracle network that connects smart contracts to real-world data like prices, wea
Chainlink is one of the most talked about names in crypto right now, and for good reason.
It's a decentralized oracle network that connects smart contracts to real-world data like prices, weather, and events, letting blockchains "see" things happening outside their own network.
This role makes it a key piece of infrastructure across DeFi, and it's why so many traders keep an eye on every move LINK makes.
That's exactly what this Chainlink Price Prediction breaks down: what's driving the current move, what the chart is showing, and the levels that matter next.
Stay till the end; there's key info here that could shape your next move.
Chainlink Price Prediction: Market Overview
Metric
Value
Price
$8.180
24H Range
$8.16 - $8.50
7D Change
+2.8%
Market Cap
$6.118B
Fully Diluted Valuation
$8.178B
24H Trading Volume
$212.629M
Total Value Locked
$1.498B
Circulating Supply
748.1M $LINK
Total / Max Supply
1B $LINK
Rank
#19
Source: Data from CoinGecko
Chainlink Price Prediction: Why Is Chainlink Price Moving Today
The bigger story behind LINK's move this week is on-chain, not just technical.
On July 16, crypto commentator Bitcoin Professor pointed out that the number of non-empty LINK wallets on Ethereum has reached an all-time high of 900,000, with more than 20,000 new wallets added over the past month, citing data from Santiment. 
That is a direct signal of rising holder count and expanding network adoption.
The post also noted that LINK's price has not yet fully caught up to that wallet growth, framing it as a question of whether the market is underestimating Chainlink's next move.
Combined with the long-heavy liquidation flush described below, the setup looks more like a pause inside an uptrend than a trend reversal, though wallet growth alone does not guarantee price follows.
LAB price forecast: Chainlink Liquidation and Volume Data
Leverage flushed out fast during the pullback from $8.564.
Chainlink saw $475.85K in total liquidations over the past 24 hours. Longs took the hit, losing $453.30K, while shorts lost just $22.56K. 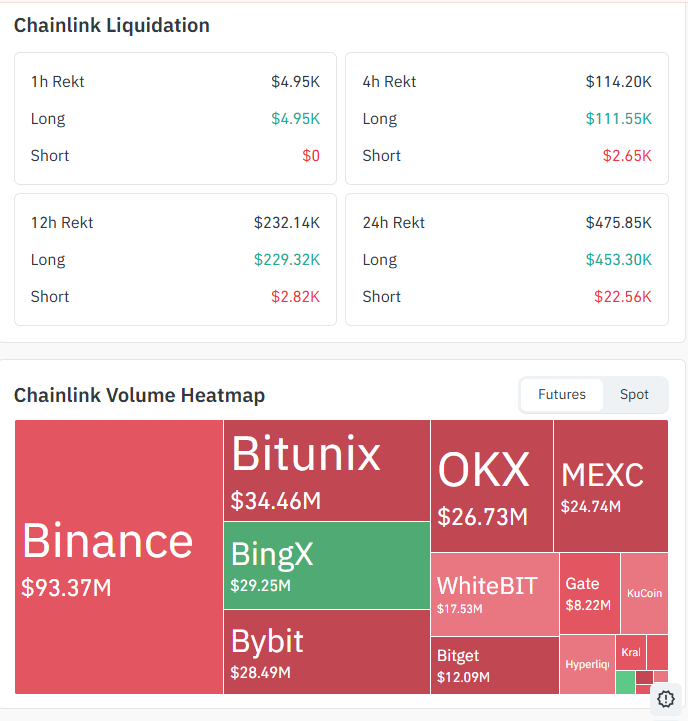
That downward split points to a long squeeze rather than fresh bearish positioning, a pattern typically seen when overleveraged buyers get shaken out inside an uptrend rather than at the start of a real reversal.
Futures volume stayed concentrated on major venues. Binance led with $93.37M in 24-hour futures volume, followed by Bitunix at $34.46M, BingX at $29.25M, Bybit at $28.49M, OKX at $26.73M, and MEXC at $24.74M.
WhiteBIT, Bitget, and Gate rounded out the rest of the heatmap with smaller but still active volume. For live order book depth, traders can check a
Chainlink Price Prediction 2026: Chainlink Chart Analysis
LINK is trading inside an ascending channel that has held since late June, with the price moving between rising trendlines rather than breaking either side.
On the 4-hour chart, the token pushed up to $8.564 before fading back to $8.180, right around the middle of the channel.
This pullback after tagging the upper trendline is normal channel behavior and does not break the broader uptrend structure in and of itself.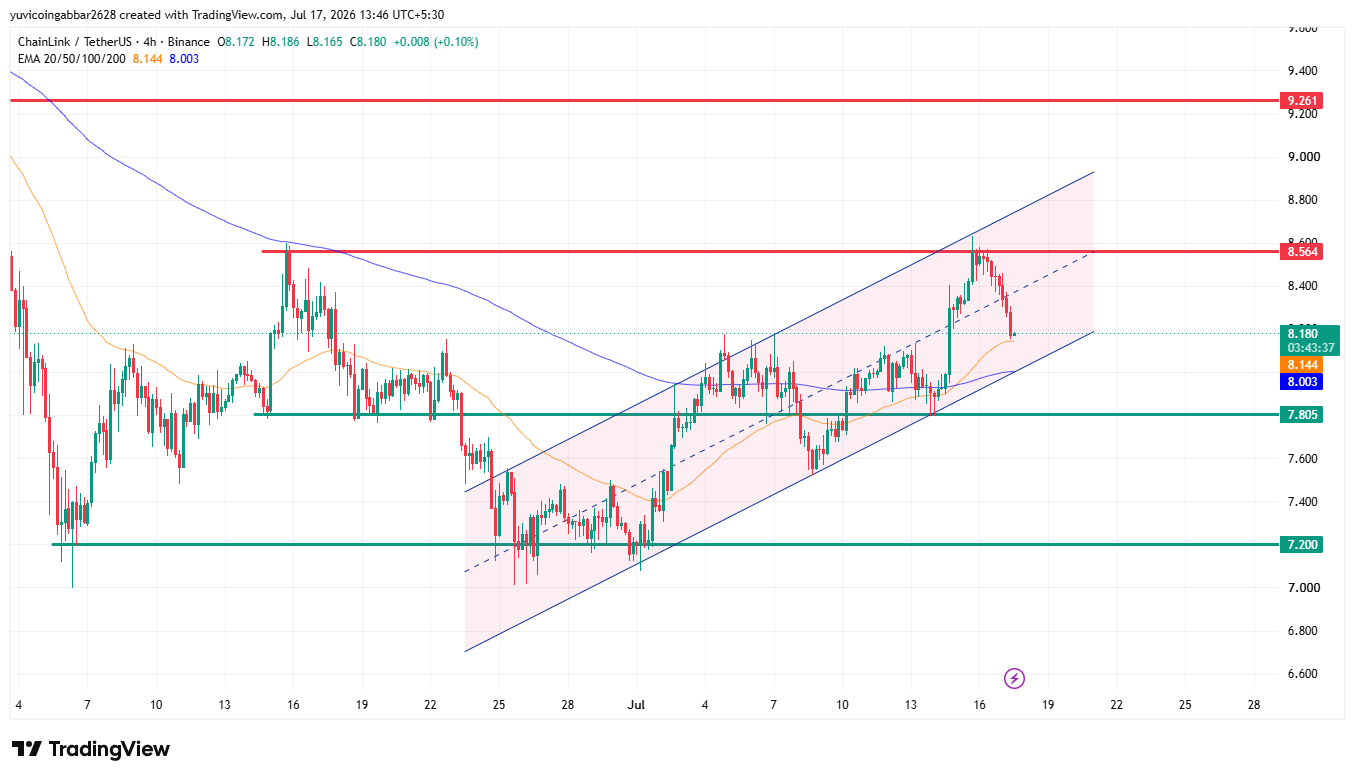
The EMAs plotted on the chart include the EMA 20 ($8.144), the midterm average, and the EMA 200 ($8.003), with a bullish crossover currently forming between the 20 and 200 EMAs.
As long as the price stays above this EMA crossover and holds the channel lower edge, the outlook remains bullish. If price fails to sustain that level and breaks the trendline, it would likely start falling and could shift into a bearish mode.
LINK target levels: Key Levels to Watch
Level Type
Price
Major Resistance
$9.261
Immediate Resistance
$8.564
Current Price
$8.180
Immediate Support
$7.805
Major Support
$7.200
Two Scenarios to Watch
Breakout Scenario: LINK reclaims $8.564 and closes above the channel with rising volume.
That opens the door toward the channel's upper band and the $9.261 resistance zone, especially if long futures positioning rebuilds in a healthier, less leveraged way than the setup that just got liquidated.
Breakdown Scenario: LINK loses the $7.805 support and the EMA cluster flips from support into resistance.
That would put the $7.200 channel floor and the ascending structure itself to the test. A daily close below $7.200 would be the clearest signal the uptrend has actually broken, not just paused.
Risk Note
LINK just cleared out a meaningful chunk of leveraged long positions, which can cut both ways. It removes some overheated positioning, which is often healthy, but it also means the market has less immediate buying power sitting on the sidelines.
Crypto markets move fast in both directions, and levels can break intraday before reversing, so position sizing and stop placement matter more than chasing any single level.
Chainlink Price Prediction 2026: Bear, Base and Bull Case
The table below is a scenario-based Chainlink price prediction for 2026, not a guarantee. Ranges are built from the current chart structure, not invented numbers.
Scenario
2026 Range
Explanation
Bear Case
$5.90 - $4.082
If the price do not sustain at the short-term support or key levels ($7.805 and $7.200), then next levels
Base Case
$8.50 - $7.00
Assumes LINK continues drifting inside the existing ascending channel, tracking the channel's upper trendline into 2026 without a decisive breakout or breakdown
Bull Case
$10.70 - $12.046
If $8.564 and $9.261 break with volume, then the long-term levels are $10.70 and 12.046
Two Reader Takeaways
For existing LINK holders, the level to watch is $7.805. Holding it keeps the current channel structure intact.
For anyone considering buying the dip, $7.200 is the level that needs to hold first before treating this as a stable entry zone rather than a falling knife.
Chainlink Price Prediction: Expert View
According to CoinGabbar analysts, the data leans constructive but not conclusive. Rising wallet adoption, a long-heavy liquidation flush, and a still-intact ascending channel all argue for the uptrend continuing.
The bear trigger is a daily close below $7.20. The bull trigger is a volume-backed close above $9.261.
Until one of those happens, LINK is range-bound between those two boundaries. For a deeper look at how Chainlink's oracle network usage feeds into long-term demand, see the following: Readers tracking the broader Chainlink token price prediction picture can also compare it against it.
DisclaimerThis article is for informational purposes only and does not constitute financial advice. Cryptocurrency markets are highly volatile, and past performance does not guarantee future results. Always do your own research before making any investment decision.