Chainlink price prediction is heating up as $LINK quietly moves toward a chart level that has already delivered several major reactions. The interesting part isn't where the price is now, but
Chainlink price prediction is heating up as $LINK quietly moves toward a chart level that has already delivered several major reactions.
The interesting part isn't where the price is now, but what usually happens next whenever this area comes back into focus.
Quick Take: LINK is trading near $8.516. This is a short-term read based on the 4-hour chart and should be rechecked if the price closes decisively beyond either $8.764 or $8.439.
Chainlink Price Right Now
Metric
Value
Price
$8.516
24h Change
-1.21% (-$0.1043)
Market Cap
$6.36B
Futures Volume (24h)
$226.07M
Spot Volume (24h)
$30.64M
Open Interest
$446.48M
Circulating Supply
748.09M LINK
Total Supply
1.00B LINK
Max Supply
1.00B LINK
Price reflects the live level on the tracked chart, with volume, market cap, open interest, and supply figures from Chainlink data on CoinGlass, as of July 26, 2026, around 3:29 PM IST.
For a live look at the same numbers, ourLINK coin tracker on CoinStats keeps this updated in real time.
Methodology And Data Sources
This Chainlink price prediction uses the 4-hour LINK/USDT perpetual chart on Binance via TradingView for price structure, with volume, open interest, and market cap figures from CoinGlass, liquidation flow from CoinGlass's LINK liquidation tracker, and ETF flow data from SoSoValue's LINK spot ETF tracker.
All levels are treated as invalidated only on a confirmed candle close beyond the stated trigger, not an intraday wick.
This is a short-term, intraday read and is not intended as a long-term Chainlink price forecast.
Why Is Chainlink In The News Today
Chainlink got a mention in a broader tokenization update from Grayscale on X, which highlighted how different chains are powering asset tokenization in distinct ways.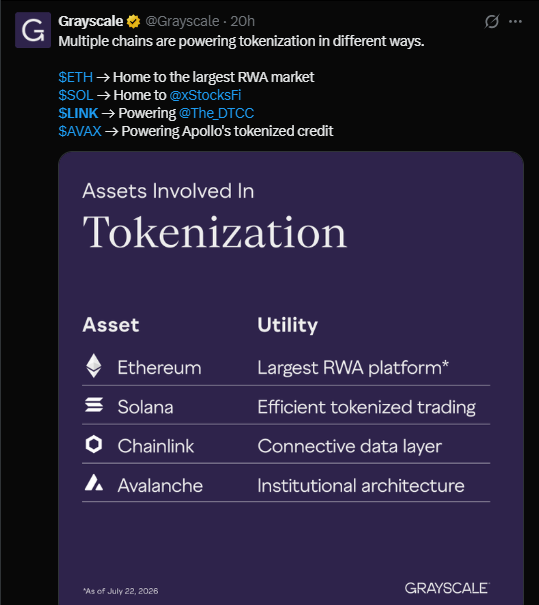
Ethereum was flagged as home to the largest real-world asset market, Solana as the base for efficient tokenized trading, and Chainlink was named as the connective data layer, with a specific nod to its role powering The DTCC. Avalanche rounded out the list, tied to institutional tokenized credit infrastructure.
The mention positions LINK's oracle infrastructure as core plumbing for institutional tokenization efforts, which is a supportive backdrop even if it is not a direct trigger for the short-term chart levels below.
Chainlink Liquidation Data Today
Liquidation activity over the past day shows a mixed picture depending on the window.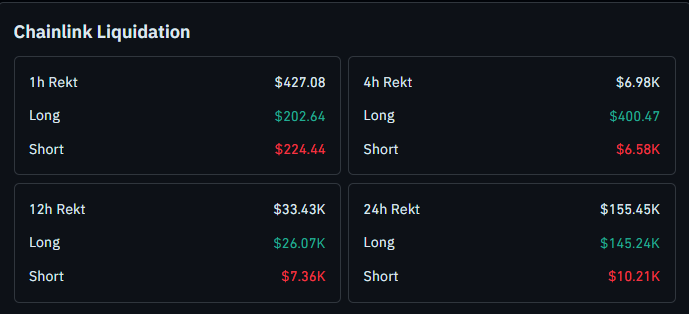
Over the past hour, $427.08 was liquidated, with $202.64 coming from longs and $224.44 from shorts, a fairly even split leaning slightly toward shorts.
The 4-hour figure shows $6.98K in total liquidations, made up of just $400.47 in longs against $6.58K in shorts, a much heavier tilt toward short positions getting caught out.
Over 12 hours, the total climbs to $33.43K, with $26.07K from longs and $7.36K from shorts, flipping the balance back toward longs.
Across the full 24 hours, liquidations reach $155.45K, and longs account for $145.24K of that figure, while shorts make up the remaining $10.21K.
The heavy day-long skew toward long liquidation lines up with the pullback candles seen after the recent high, while the short-heavy readings on the 1h and 4h windows suggest late sellers near the current price are the ones getting squeezed. A full breakdown is available through the LINK breakout that could change every piece of CoinGlass liquidation data.
Chainlink ETF Flows: What The Data Shows
According to SoSoValue's LINK spot ETF tracker, $LINK spot ETF products logged a daily net inflow of $153.91K on July 23, pushing cumulative net inflows to $127.98 million with total net assets at $114.78 million and $2.13 million in value traded that day.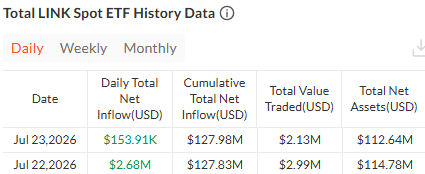
The day before, July 22, saw a smaller net inflow of $2.68K, with cumulative inflows at $127.83 million and $2.99 million in value traded.
The back-to-back positive days suggest steady, if modest, institutional demand building alongside the current chart setup, worth treating as background support rather than a standalone signal.
Chainlink Price Prediction: 4-Hour Chart Analysis
On the 4-hour chart,$LINK has been following the same ascending line since the start of July, and the pattern has been consistent.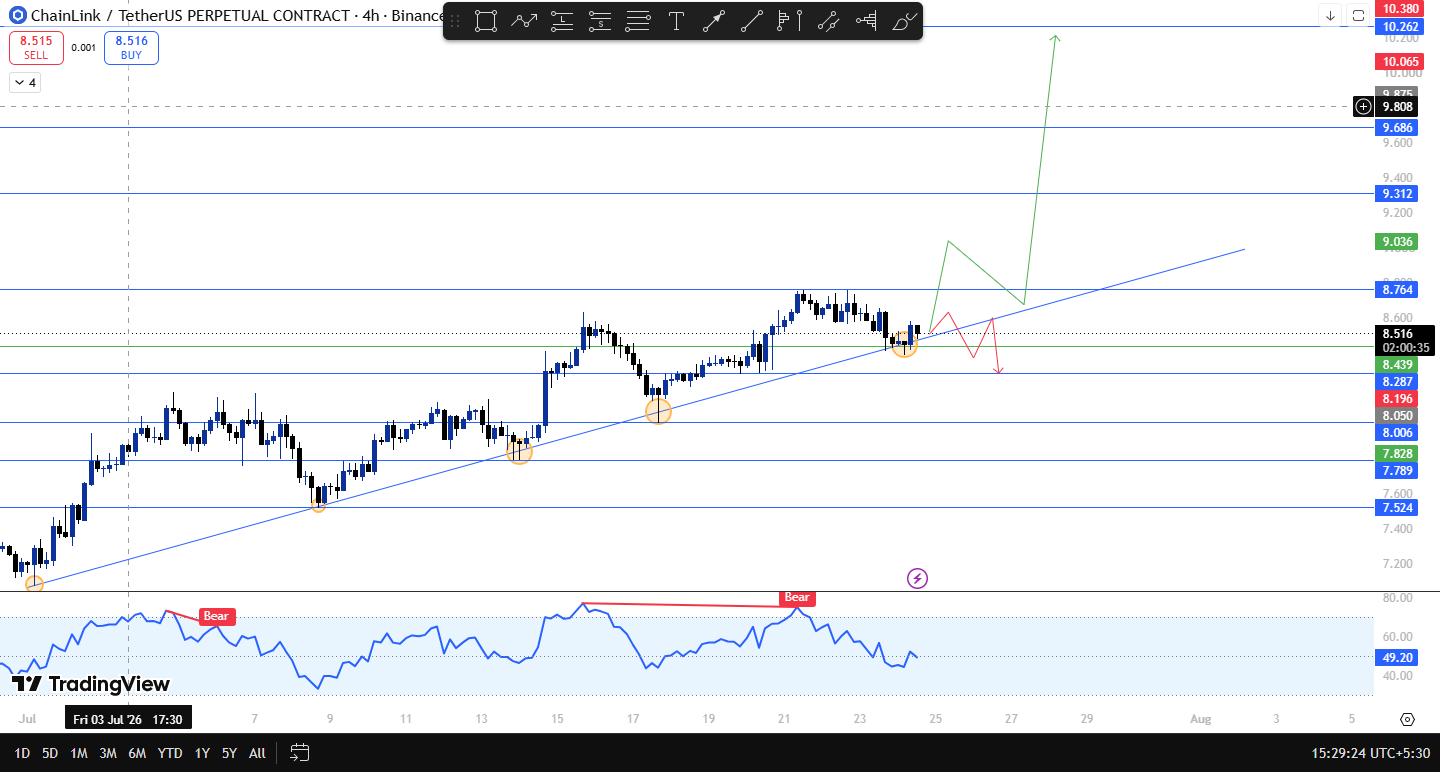
Every time the price comes down to test it, buyers step in, and the move resumes higher.
This latest touch marks the fifth time price has rested on that rising support before attempting another leg up, a track record covered in more depth in ourLINK institutional buzz coverage.
If aggressive buying shows up here, or if the price simply continues to respect this rising line the way it has four times before, the next resistance levels come into play at $8.764, then a zone between $9.312 and $9.686, with $10.262 as the extended target beyond that.
If the price instead breaks down and closes below $8.439, that would mark a failure of this well-tested structure, increasing the probability of a move toward to $8.287 and then $8.006 as the next levels in view.
Chainlink Technical Snapshot
Indicator
Signal
Trend
This is the fifth test of the same ascending line since early July; prior touches all held
Structure
Buyers have stepped in on every retest so far; current tap in progress
Liquidations
Shorts dominate the 1h and 4h totals; longs took the bigger 12h and 24h hit
ETF Flows
Two straight days of net inflows, modest but positive
News Flow
Grayscale tokenization update names LINK as a connective data layer for institutions
For a closer look at how a similar setup unfolded before, ourLINK double confirmation breakdown covers a comparable stage of this structure.
Chainlink Support And Resistance Levels To Watch
Type
Level
Note
Resistance 3
$10.262
Extended upside target
Resistance 2
$9.312 & $9.686
2nd to watch after the first level clears
Resistance 1
$8.764
First target if this trendline tap holds
Current Price
$8.516
Testing the ascending line for a fifth time
Support 1
$8.439
A confirmed close below marks a break of the rising structure
Support 2
$8.287
Next level on a confirmed close below $8.439
Support 3
$8.006
Deeper support beyond $8.287
Risk-Reward Table
Case
Trigger
Target
Bull Case
Holds the trendline and buying picks up
Move toward $8.764, then $9.312 to $9.686, then $10.262
Bear Case
Breaks and closes below $8.439
Slide toward $8.287, then $8.006
Invalidation Level
The bullish structure on $LINK stays intact as long as the price holds this ascending line and closes above $8.439.
A confirmed close below that level would invalidate the current trendline setup and shift focus to $8.287, then $8.006.
If the price instead pushes on to a confirmed close above $8.764, that is treated as strong confirmation the fifth retest has succeeded, with $9.312 to $9.686 and eventually $10.262 next in view.
This lines up with the closing-basis approach used in ourLINK bullish breakout coverage, where a similar trigger determined the next leg.
Historical Context
What makes this setup notable is the consistency behind it.
Four earlier tests of this same rising line all resolved in favor of buyers, and price has climbed steadily since the start of July as a result.
That kind of track record does not guarantee a fifth potential successful retest , but it does add weight to how this current retest is being read, a theme explored further in our LINK integration boost break 10 coverage.
Whether LINK extends this run toward $10.262 or finally loses the line and slides toward $8.006 should become clearer over the next several candles.
How Bitcoin Could Influence LINK
While this setup is based on $LINK's own 4-hour chart, Bitcoin remains an important backdrop for how altcoins move.
A stable or rising Bitcoin would improve the odds of LINK holding this trendline and working toward $8.764 and beyond.
A sharper Bitcoin pullback, on the other hand, would raise the chances of LINK losing $8.439 and sliding toward $8.287 or $8.006, regardless of how well the line has held so far.
For a broader look at how $LINK has handled institutional catalysts before, ourChainlink price prediction today piece provides additional context.
Chainlink Glossary
Ascending Trendline: A rising line connecting a series of higher lows, used to track the pace and structure of an uptrend.Retest: A return to a previously broken or respected level, used to judge whether that level still holds significance.Liquidation: What happens when a leveraged trade gets forcibly closed because the trader ran out of margin to keep it open.ETF Net Inflow: The amount of new money entering an ETF product on a given day, used as a rough gauge of institutional demand.
Expert View
The consistency of this rising line is the standout feature of the current LINK setup, with four prior touches all resolving in favor of buyers before this fifth test.
A hold here, backed by two straight days of ETF inflows and a supportive institutional headline from Grayscale, would support a move toward $8.764 and potentially $9.312 to $9.686.
A confirmed close below $8.439 would suggest the bullish structure would weaken, with $8.287 and $8.006 becoming the next levels to watch.
Given the track record so far, this fifth retest is one of the more closely watched setups on the chart this week.
Disclaimer: This article is written for educational and informational purposes only. Nothing here is financial advice. Cryptocurrency markets are volatile and unpredictable