Something has been building quietly on the Chainlink chart, and traders who follow LINK closely are starting to take notice. After months of grinding sideways and testing patience, price acti
Something has been building quietly on the Chainlink chart, and traders who follow LINK closely are starting to take notice.
After months of grinding sideways and testing patience, price action is now flashing signals that could decide the coin's next big chapter.
This Chainlink price prediction September 2026 breaks down exactly what's unfolding on the higher timeframes, where the real battle between buyers and sellers is playing out, and what needs to happen for LINK to make its next major move.
Institutional money is also quietly entering the picture, adding another layer to a setup that's hard to ignore right now.
Chainlink Price Today: Live Data and 24-Hour Change
LINK is trading near $11.768 on the weekly chart.
Separate live data from CoinGlass puts the coin around $11.734, up roughly 3.26% over the past 24 hours, with futures volume of $703.48 million against spot volume of $127.07 million and open interest at $682.54 million.
Market cap stands at $8.80 billion on a circulating supply of 748.09 million LINK, against a total and max supply of 1 billion tokens, meaning close to 75% of all LINK that will ever exist is already in circulation.
Source: TradingView (LINKUSDT perpetual, Bybit, weekly chart) and CoinGlass, both accessed August 25, 2026, IST.
Chainlink News: Coinbase Taps LINK for Tokenized Stocks
Fresh news broke on August 24, 2026, when crypto commentary account @RealAllinCrypto reported that Coinbase has selected Chainlink as the official oracle infrastructure for tokenized U.S. stocks on Base.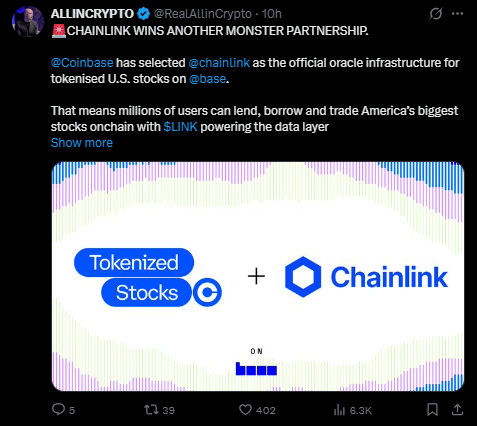
The integration would let users lend, borrow, and trade tokenized versions of major American stocks onchain, with Chainlink's data layer powering the pricing and settlement underneath it.
This kind of deal matters because it puts LINK's infrastructure at the center of another high-profile, real-world use case, this time tied directly to U.S. equities rather than crypto-native assets.
It adds to a growing list of institutional integrations that keep expanding Chainlink's role well beyond simple price feeds.
Source: X post by @RealAllinCrypto, August 24 to 25, 2026.
LINK Spot ETF Flows Turn Consistently Positive
LINK-linked spot ETF products have now logged four straight weeks of positive net inflows through August 24, 2026.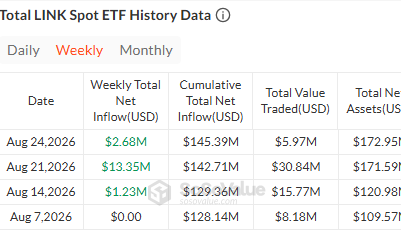
Weekly inflows came in at $2.68 million on August 24, $13.35 million on August 21, and $1.23 million on August 14, pushing cumulative net inflows past $145 million.
That steady, uninterrupted run of inflows suggests institutional demand has been building in the background even while price consolidated, which lines up with the broader Chainlink price prediction September 2026 outlook laid out below.
Source: SoSoValue, data through August 24, 2026.
Quick Take
CMP: $11.768
Weekly trigger: close above $15.000, opens $20.757, then $27.882, then $30.859
Major long-term resistance: $38.353
Possible pullback zone before continuation: near $10.000
Weekly failure: close below $8.000 invalidates the bullish structure, opens $7.150
Data as of August 25, 2026, IST
Short risk note: these levels come from the weekly chart and depend on confirmed weekly closes, not intraday wicks.
Leveraged positions around these zones carry liquidation risk if price whipsaws before a level is confirmed.
Chainlink Technical Forecast September 2026
LINK's weekly chart has been shaped by a long descending trendline that capped every rally attempt for months.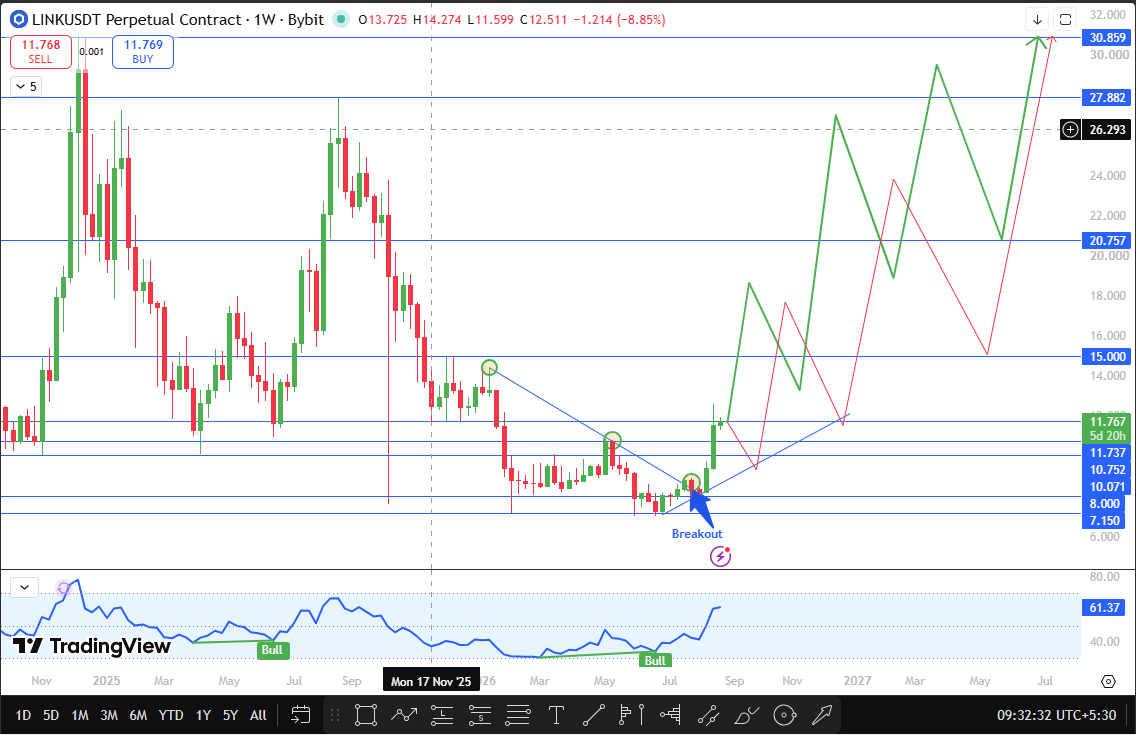
On its second retest, that trendline failed to produce a fresh lower low.
Instead, buyers stepped in aggressively and forced a breakout, a sign that sellers lost control of the structure right when they needed to defend it.
Since that breakout, price has also started respecting a newly formed ascending trendline, connecting a series of higher lows.
This gives LINK two supportive structures working together heading into September: the reclaimed descending trendline turned support and the fresh ascending trendline underneath the current price.
If LINK breaks and closes a weekly candle above $15.000, it opens the door to $20.757 as the first major resistance, followed by $27.882 and then $30.859. Beyond that, $38.353 stands out as the next major long-term resistance zone.
A pullback toward the $10.000 area remains a realistic scenario even within a bullish structure.
If that happens, the ascending trendline would be the level to watch for renewed support, potentially setting up another breakout attempt rather than a trend reversal.
On the downside, a weekly close below $8.000 would invalidate this bullish structure entirely, shifting focus toward $7.150 as the next support to watch.
Source: TradingView, LINKUSDT perpetual chart, 1-week timeframe, Bybit, captured August 25, 2026, IST.
Chainlink Support and Resistance Levels to Watch
Level Type
Price
Note
Support
$10.000
Ascending trendline retest zone on a pullback
Support
$8.000
Weekly close below this invalidates the bullish setup
Support
$7.150
Next support if $8.000 fails
Resistance
$15.000
The weekly close above this confirms the breakout
Resistance
$20.757
First target after breakout confirmation
Resistance
$27.882
Second target on continued strength
Resistance
$30.859
Third target zone
Resistance
$38.353
Major long-term resistance
LINK Price Prediction: Bull, Base, and Bear Cases
The base case has LINK continuing to build a base between the $10.000 support zone and the $15.000 resistance trigger through most of September, without a confirmed weekly close on either side.
The bull case activates on a weekly close above $15.000, which opens a path toward $20.757, then $27.882, and eventually $30.859, with $38.353 coming into play if momentum extends further.
This case gets extra support from the growing institutional footprint described above, including the Coinbase oracle deal and the steady LINK spot ETF inflows.
The bear case needs a weekly close below $8.000, which would undo the recent breakout structure and expose $7.150 as the next support.
Every one of these link price prediction September 2026 scenarios depends on a confirmed weekly close, not a temporary wick through any level.
On-Chain and Fundamental Drivers
The strongest fundamental push for Chainlink right now comes from real-world integrations landing back to back.
The Coinbase and Base tokenized stocks deal adds Chainlink to the plumbing behind one of the biggest on-chain equity pushes attempted so far, while consistent LINK spot ETF inflows point to institutional buyers building positions rather than trading short-term swings.
Together, these two threads give the current LINK technical analysis September 2026 setup more weight than a chart pattern alone would carry.
September 2026 Catalysts That Could Move LINK
The Coinbase and Base tokenized stocks integration is the headline catalyst heading into September, placing Chainlink at the center of U.S. equities moving on-chain for the first time at this scale.
If adoption around this integration keeps expanding, it strengthens the case for any breakout above $15.000, since real usage tends to support demand even through quiet consolidation stretches.
Continued LINK spot ETF inflows and the broader direction of Bitcoin and Ethereum will also shape how much of this bullish LINK price outlook for September 2026 actually plays out.
What Analysts Are Forecasting for Chainlink
Sentiment around LINK is split between traders reading the failed lower low and aggressive breakout as the start of a genuine trend shift and others waiting for a confirmed weekly close above $15.000 before fully buying into the move.
The Coinbase oracle news and steady ETF inflows add a fresh fundamental argument to the bullish side, but the chart still needs that confirmed close to validate the LINK breakout prediction September 2026 traders are watching for.
Chainlink Long-Term Outlook: 2027 to 2030
A sustained break above the $30.859 to $38.353 resistance band would meaningfully strengthen Chainlink's longer-term structure, and continued real-world integrations give that case more backing than the chart alone.
The near-term path through September still depends on price holding above the $8.000 to $10.000 zone.
Risks That Could Invalidate This Forecast
This bullish setup fails if LINK cannot close a weekly candle above $15.000, and fails more seriously if the price closes below $8.000, which opens $7.150 next.
Broader risks include shifts in Bitcoin dominance, macro liquidity conditions, and general crypto market volatility, any of which could override Chainlink's own chart structure regardless of where its trendlines sit.
How to Buy and Store Chainlink Safely
LINK can be bought on major exchanges that support spot and futures markets, then moved to a personal wallet for storage rather than left sitting on an exchange long-term.
Hardware wallets are generally considered the safer option for holding larger amounts, and enabling two-factor authentication on any exchange account remains a basic but important precaution.
Glossary
Descending trendline: a downward-sloping line connecting a series of lower highs, used to track a prevailing downtrend
Ascending trendline: an upward-sloping line connecting a series of higher lows, used to track a prevailing uptrend
Lower low: a price low that forms below the previous low, generally read as a sign of continuing downward pressure
Breakout: a decisive move through a trendline or resistance level, often signaling a shift in market control
Weekly close: the final traded price when a weekly candle finishes, used to confirm whether a breakout or breakdown is genuine
Open interest: the total number of outstanding futures or options contracts that have not yet been settled
Support: a price zone where buying pressure has previously stepped in
Resistance: a price zone where selling pressure has previously capped upside
Invalidation level: the price point at which a forecast scenario is considered incorrect
Disclaimer
This article is for informational purposes only and does not constitute financial advice. Cryptocurrency markets are highly volatile, and all price levels discussed are based on technical chart analysis, not a guarantee of future performance. Readers should conduct their own research before making any investment decisions.