Published comparisons of USDT transfer costs across TRC20, ERC20, and BEP20 frequently contradict one another, including guides published within days of each other that invert the cost rankin
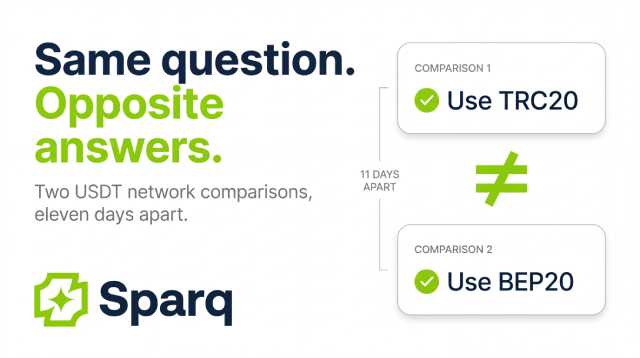
Published comparisons of USDT transfer costs across TRC20, ERC20, and BEP20 frequently contradict one another, including guides published within days of each other that invert the cost ranking entirely. This occurs because network fees are dynamic and any stated figure is a snapshot presented as a stable property. The reliable decision factors are structural rather than numerical: what the destination natively supports, whether a bridge will be required afterward, and the live fee at the moment of sending.
The contradiction in published data
Why fee tables go stale immediately
The factors that are actually stable
Why bridging dominates fee optimisation
Choosing per transaction
FAQ
Two network comparison guides published in May 2026, eleven days apart, produce incompatible figures for the same three networks.
Network
Guide published 15 May 2026
Guide published 25 May 2026
TRC20
$2–$5
$0.10–$1.50
ERC20
~$0.07–$0.19
$5–$35+
BEP20
~$0.02
$0.05–$0.50
The divergence on ERC20 exceeds two orders of magnitude. More significantly, the two sources invert the ranking: the first presents Ethereum as among the least expensive options, the second as substantially the most expensive.
Both cannot describe the same conditions. At minimum one reflects an unrepresentative sampling window, and plausibly both reflect accurate observations of different moments presented as general properties.
Transaction fees on these networks are not fixed parameters. They respond to network congestion, prevailing gas prices, and the market price of the token in which fees are denominated.
A figure described as a "typical fee" is therefore a measurement taken at a particular time, formatted with the presentational conventions of a specification. The format implies stability the underlying value does not have.
This applies to well-researched comparisons as much as careless ones. The problem is not accuracy at the point of publication — it is that the quantity being published changes faster than the content describing it.
The practical consequence is that a reader forms a default ("use TRC20 for transfers") based on conditions that may no longer hold, and has no trigger prompting re-evaluation, because a cached answer does not announce when it becomes stale.
Several considerations do not fluctuate with congestion and are therefore sounder bases for a decision.
Destination support. The cheapest network provides no benefit if the receiving address, exchange, or service does not support it. Sending to an unsupported network risks loss of funds and is the most consequential error available in this category.
Finality characteristics. Networks differ structurally in how quickly and under what conditions transactions become final. This is a property of the network design rather than of current demand.
Bridging requirement. Whether the destination natively accepts the network chosen determines whether an additional conversion step follows.
The most common expensive mistake is optimising the transfer fee and then requiring a bridge.
Bridging between chains typically costs approximately 0.15% to 0.6% of the amount plus a delay of roughly 5 to 45 minutes depending on route. On most transfer sizes this substantially exceeds the entire fee difference between the three networks under any of the figures cited above.
The implication is that network selection should be driven primarily by what the destination natively accepts, with fee comparison as a secondary consideration applied only among networks the destination already supports.
Selecting the cheapest network and bridging afterward is a local optimum that reliably produces a worse total cost.
Given that the cost ranking is unstable and the structural factors are not, the robust position is to avoid committing to a single network.
This requires the destination to support multiple networks natively. Where a service accepts only one, the choice is made for the user at integration time, and they inherit whatever conditions that network presents on any given day.
Sparq supports native top-up over TRC20, BEP20, and ERC20. The argument is not that any one of these is superior — the contradictory data above indicates such a claim would not survive scrutiny. The argument is that per-transaction selection against live conditions is the only approach robust to a variable that demonstrably moves.
Cards are funded from BTC, ETH, and USDT, issued on debit BINs across multiple countries with 3-D Secure and recurring billing supported, non-custodial and PCI DSS compliant, on Visa and Mastercard.