The crypto crash deepened on Thursday, November 5, 2026, as Bitcoin slid below $76,000. Tech stocks sold off at the same time. The wider market lost 5% and now sits near $2.65 trillion. Ether
The crypto crash deepened on Thursday, November 5, 2026, as Bitcoin slid below $76,000. Tech stocks sold off at the same time.
The wider market lost 5% and now sits near $2.65 trillion. Ethereum, XRP and Solana fell 7% to 8%.
More than $1.25 billion in positions were liquidated in 24 hours. Most of them were longs.
Why the Crash Hit Crypto So Hard
Wall Street led the move. The Nasdaq Composite fell 5.52% at the close, its lowest point since July 29. The S&P 500 dropped 4.36%.
Chip stocks took the worst hit. The Semiconductor Index lost 10%, led by Nvidia, AMD and Qualcomm. Qualcomm slid on weaker smartphone chip sales.
Traders also link the drop to the midterm results. Democrats now control the House and Senate, and investors fear tougher rules on data center building. Less AI spending could mean less chip demand, and crypto followed tech lower.
Oil added to the stress. WTI climbed back above $90 a barrel, while Brent rose about 2.5% to near $97 after reports of fresh tanker attacks. There were also reports that the US military is preparing for a possible return to major combat in Iran.
Coinbase and Strategy shares fell at least 9% intraday. Peter Schiff warned traders to "expect more days like today."
Economist Mohamed El-Erian asked a fair question too. How would the economy hold up if tech earnings and investment stopped supporting growth?
Liquidations and Fear Index Tell the Story
CoinGlass data shows 239,861 traders were liquidated. Longs lost $1.11 billion (88.7%), while shorts lost $142.08 million (11.3%).
Bitcoin led with $329.57 million in liquidations. Ethereum followed with $210.36 million, then Solana with $43.26 million. Binance had the biggest exchange share at 45.1%.
The Crypto Fear & Greed Index fell to 28, which signals Fear. It read 50 yesterday, 30 last week, and 71 last month.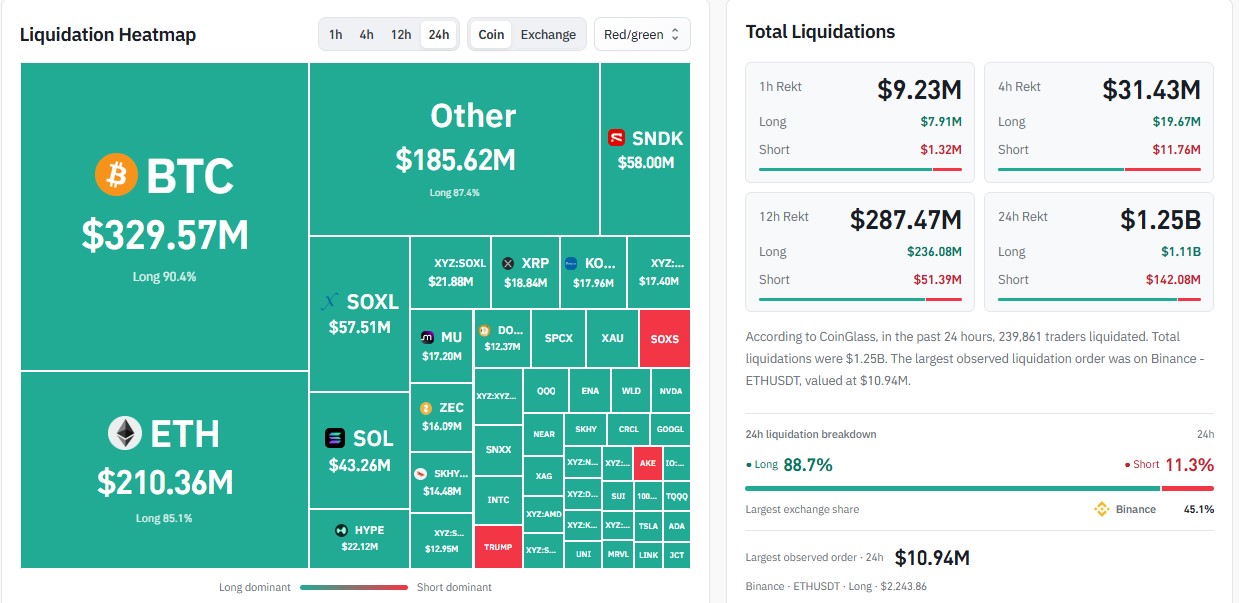
Bitcoin Price Outlook: Will $74,000 Hold?
BTC trades near $75,806, down 5.8% or $4,667.46 in 24 hours. It had climbed to about $81,100 before the reversal.
On the daily chart, Bitcoin is below its 20-, 50-, 100- and 200-day EMAs. It also broke the lower edge of a descending channel.
RSI is near 37.88. That shows weak momentum, but not an oversold market yet.
If buyers fail to defend $74,000 to $75,000, a drop toward $72,000 and then $70,000 is possible. A move back above $76,500 may bring a short bounce.
Ethereum Price Outlook: $2,200 Is the Line
ETH trades near $2,227. Its 24-hour range ran from $2,203.81 to $2,431.81, a swing of more than 8%.
Over seven days, Ether is down only 1%, because it rallied sharply on Wednesday. Sellers hit hard near the $2,450 to $2,500 zone.
ETH sits below all major moving averages, and RSI is near 38.76. If $2,200 breaks, the next stops are $2,150 and $2,100.
A sustained move above $2,315 to $2,400 could signal a short-term reversal. The next resistance would be near $2,500.
XRP Price Outlook: Three Scenarios Near $1.20
XRP sits near $1.20 after a breakdown. It keeps printing lower highs and lower lows inside a descending channel.
The token trades below the 20, 50, 100, and 200 EMAs. RSI is near 34.85, close to oversold.
Oversold does not mean a bottom. A bounce can fade fast.
Bearish:A daily close below $1.20 confirms the breakdown. Targets are $1.15, then $1.10.
Neutral: If buyers defend $1.20, a relief bounce toward $1.25 to $1.28 is possible.
Bullish: XRP must reclaim $1.32 to $1.36 and break the trendline on strong volume.
Key Price Levels at a Glance
Asset
Current Price
Support Levels
Resistance Levels
RSI (Daily)
Bitcoin (BTC)
~$75,806
$74,000 to $75,000, $72,000, $70,000
$76,500
37.88
Ethereum (ETH)
~$2,227
$2,200, $2,150, $2,100
$2,315 to $2,400, $2,500
38.76
XRP
~$1.20
$1.20, $1.15, $1.10
$1.25 to $1.28, $1.32 to $1.36
34.85
What Traders Watch Next
The first test is simple. Can Bitcoin hold $74,000 to $75,000, Ether hold $2,200, and XRP hold $1.20?
Tech stocks matter just as much. Another crash in chip shares could pull crypto lower again.
A calmer Nasdaq could give buyers room to breathe. Nobody knows which way it goes, so risk control comes first.
Disclaimer
This article is for information only and is not financial, investment or trading advice. Cryptocurrency prices are highly volatile, and you can lose some or all of your money. Price levels mentioned are based on technical analysis and are not guaranteed. Always do your own research and speak with a licensed financial advisor before making any investment decision.
