The crypto crash is not letting up. $Bitcoin trades at $65,430 after losing 13.7% in seven days. $Ethereum sits at $1,827, down 18.1% on the week, and $XRP is back below $1 at $0.963, almost
The crypto crash is not letting up. $Bitcoin trades at $65,430 after losing 13.7% in seven days. $Ethereum sits at $1,827, down 18.1% on the week, and $XRP is back below $1 at $0.963, almost 48% lower than at the start of the year. The Fear and Greed Index reads 13, deep in extreme fear.
So where does the selling stop? Below is our crypto crash prediction for all three coins: the key support, the worst case if that support breaks, and the level that would signal a recovery. We also cover the dates next week that could decide the direction. Live prices are on our crypto prices page.
Crypto crash prediction: where could prices bottom?
The table sums up the levels that matter most right now. Prices and changes are from Sunday, November 15, 2026.
Coin
Price
7 days
Since January
Key support
Worst case
Recovery trigger
$BTC
$65,430
-13.7%
-25.2%
$60,000 to $62,000
$58,000
Weekly close above $67,850
$ETH
$1,827
-18.1%
-38.4%
$1,750 to $1,850
$1,450 to $1,550
Daily close above $2,000
$XRP
$0.963
-16.9%
-47.7%
$0.85 to $0.90
$0.75
Daily close above $1.00
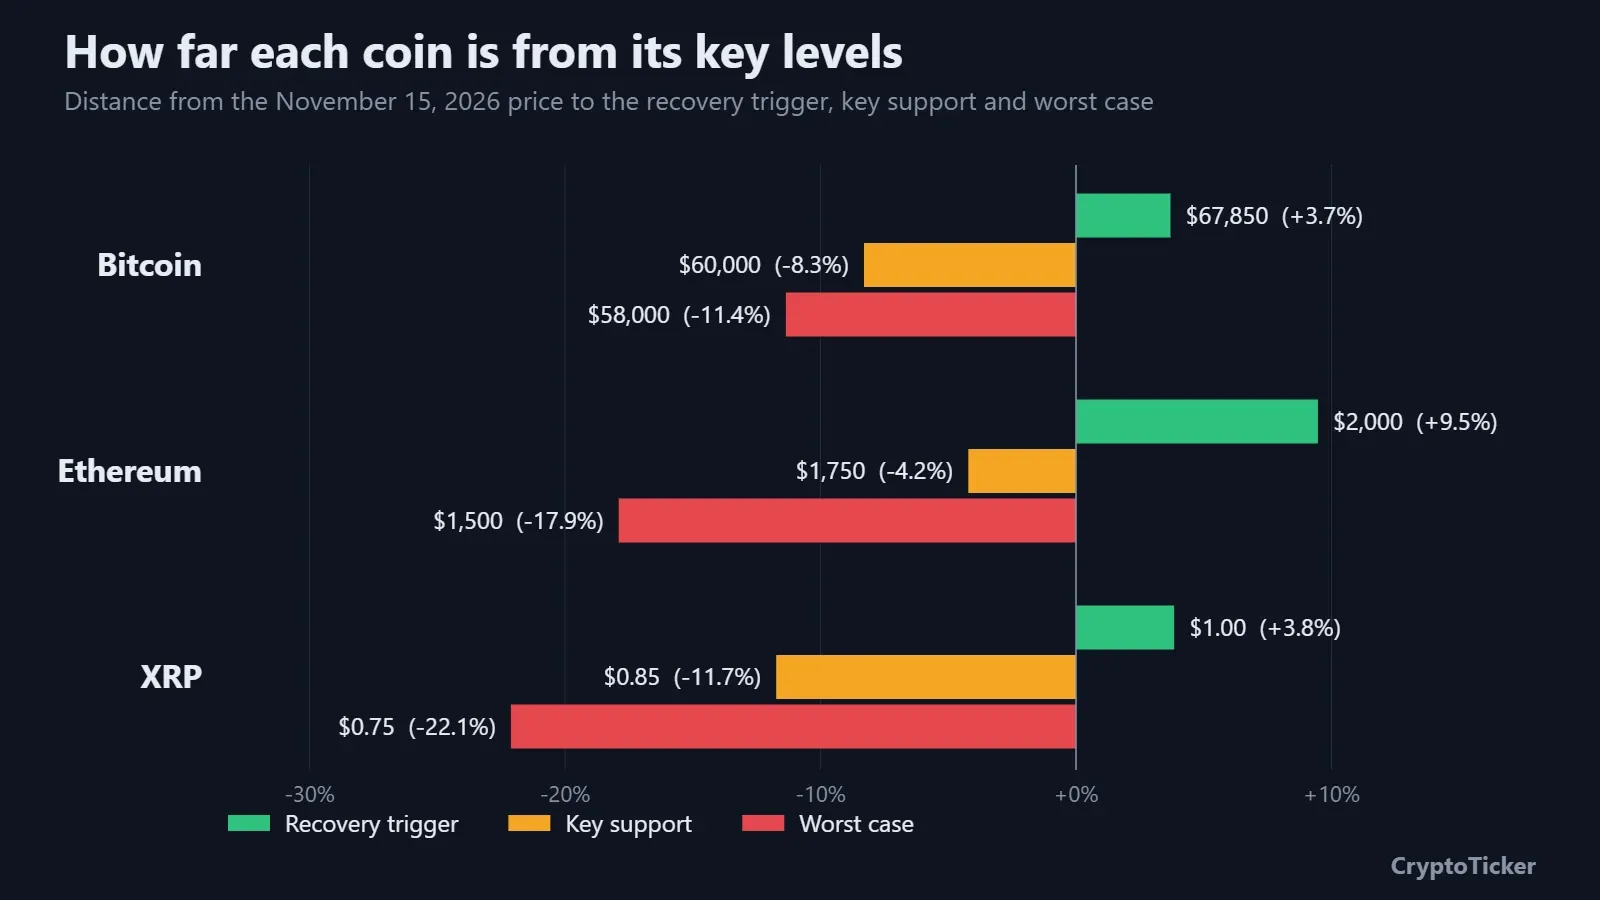
Distance from the current price to the key levels
The pattern is clear: Bitcoin is holding up best, while Ethereum and XRP sit closer to deeper downside targets. That fits a classic risk-off move, where money leaves the riskier coins first.
Crypto crash: why is the selling so heavy this week?
- ETF outflows: US spot Bitcoin ETFs lost about $1.91 billion over seven sessions from November 5 to 13, according to Farside Investors. Ether ETFs lost $695.9 million in November through November 11, and XRP ETFs had their biggest weekly outflow in about eight months at $19.1 million.
- Liquidations: around $1.96 billion in leveraged positions were wiped out in 24 hours, according to CoinGlass. About 80% of the Bitcoin liquidations hit long positions.
- Rates: October consumer prices rose 0.4% and core prices 0.3%, which pushes back hopes for Fed rate cuts.
- Competition for capital: Anthropic lists on Nasdaq on Thursday, November 19. Whether investors are selling crypto to buy in is still an open question, and we look at the data in our Anthropic IPO analysis.
For the full breakdown, read why crypto is crashing.
How low can Bitcoin go?
Bitcoin lost its 200-week moving average this week. The line now sits around $67,850 and has acted as a floor in past bear markets, so a break below it is a warning sign. On Sunday, BTC dropped as low as $62,080, its lowest level in three months.
The first support is the $60,000 to $62,000 zone, where buyers already stepped in on the way down. If that fails, the next target is the July 1 low at $58,570. The $58,000 level also matters for options traders: the monthly expiry on November 27 has a large put block there.
There is one argument for a bounce. The daily RSI is around 22, deeply oversold. That often comes before a relief rally, but oversold markets can stay oversold for weeks. For a real recovery, Bitcoin needs a weekly close back above $67,850. Above that, $73,000 comes into view, the "max pain" level for Friday's options expiry. More detail in our Bitcoin price prediction after the 200-week break.
Ethereum price prediction: is $1,500 next?
Ethereum lost the $2,000 mark on November 13 and has kept sliding. It now trades inside the $1,750 to $1,850 zone, an area where buyers stepped in several times before. That zone is the last line of defense before a much bigger gap.
If it breaks, analysts point to $1,450 to $1,550 as the next target. That zone is seen as the average cost basis of long-term institutional investors, which is why buyers could show up there. ETH also trades far below its 200-week moving average at around $2,560, a sign of how weak the trend is.
The pressure comes from several sides: steady outflows from the Ether ETFs, heavy long liquidations and the fallout from the Binance hack in late October, where Ethereum was the hardest hit network. For a recovery, ETH needs a daily close back above $2,000, then $2,100. Our Ethereum price analysis has the full chart.
XRP price prediction: will XRP hold $0.90?
XRP has fallen the hardest of the three this year, down almost 48%. On Sunday it dropped to $0.89, its lowest level since November 2024, before bouncing toward $0.96.
The first support is $0.90, with $0.85 just below. Some analysts flag $0.75 as the worst case if the market keeps falling. One warning sign: the 50-day average of XRP whale transfers to Binance has nearly doubled since August, according to CryptoQuant. Transfers to an exchange are not confirmed sales, but they often come before selling.
Another date to watch is December 1, when Ripple's next monthly escrow release makes 1 billion XRP available. For a recovery, XRP needs to get back above $1.00, then the $1.12 to $1.16 zone where its 20-day average sits. More in our XRP price prediction.
When will crypto stop crashing? The dates that decide
No one can call the exact bottom, but next week brings several events that could change the mood. All times are CET.
- Monday, November 16: the first ETF flow data of the week. A day of inflows would be the first real sign that the selling is fading.
- Tuesday, November 17, 10:20 p.m.: Nvidia reports its quarterly results. A miss could hit tech stocks and crypto together.
- Wednesday, November 18, 8:00 p.m.: the Fed publishes the minutes of its October meeting.
- Thursday, November 19: Anthropic starts trading on Nasdaq.
- Friday, November 20, 9:00 a.m.: about 28,300 BTC in options expire on Deribit, with max pain at $73,000.
The full schedule is in our Bitcoin week ahead.
Bitcoin price crash: our base, bear and bull case
Base case: the market keeps chopping lower and tests support. Bitcoin revisits $60,000 to $62,000, Ethereum holds around $1,750 and XRP tests $0.90. Oversold readings then trigger a relief bounce.
Bear case: ETF outflows continue after the Anthropic listing and Bitcoin loses $58,000. In that scenario, Ethereum likely heads to $1,500 and XRP to $0.75.
Bull case: ETF flows turn positive and Bitcoin reclaims the 200-week line at $67,850. Ethereum would then be back above $2,000 and XRP above $1.
Our view: Bitcoin is the coin to watch. As long as it holds $60,000, Ethereum and XRP have a chance to stabilize. If it breaks, the altcoins will likely fall harder. Keep an eye on the ETF flows and the Fear and Greed Index this week: a turn in both would be the clearest sign that the worst is over.
