The crypto crash kept grinding through the week ending October 25, 2026. Four of the five largest non-stablecoin cryptos closed the week in the red, and the two biggest names, $Bitcoin and $E
The crypto crash kept grinding through the week ending October 25, 2026. Four of the five largest non-stablecoin cryptos closed the week in the red, and the two biggest names, $Bitcoin and $Ethereum, lost 2.27% and 3.95% respectively. The market did not collapse in one dramatic candle. It bled slowly, day after day, with every bounce sold into.
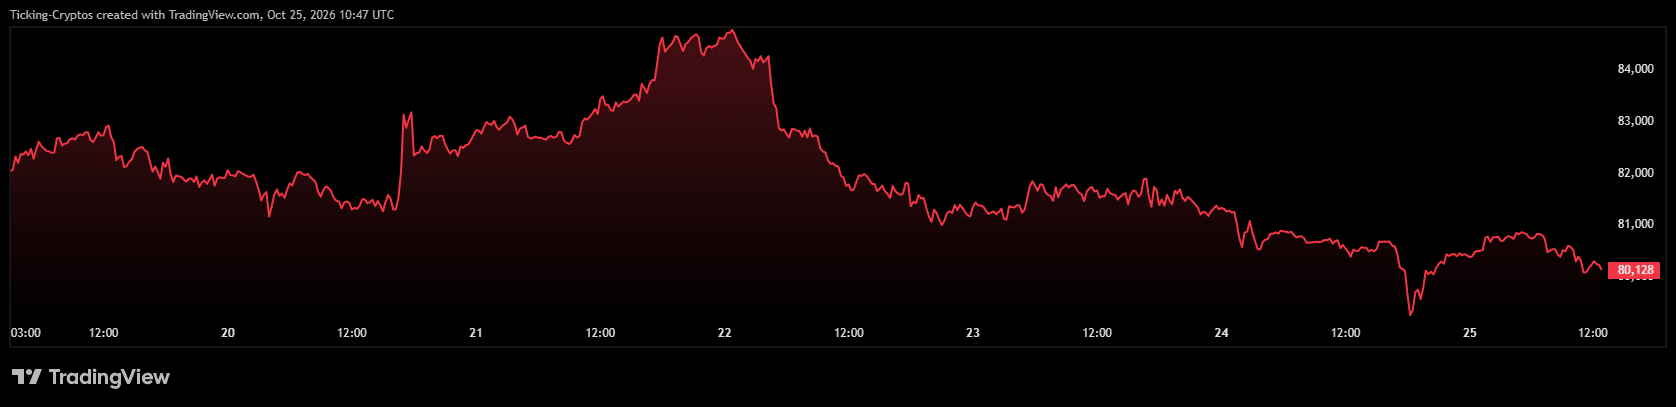
BTC/USD chart
The bigger picture is worse than the weekly chart suggests. Year to date, Ethereum is down more than 21%, Solana more than 19% and XRP almost 30%. Bitcoin, the supposed anchor of the market, has given back 8.34% in 2026. Only BNB managed a green week, and even it remains 14.56% below where it started the year.
Here is where the top coins stood on Sunday, October 25, 2026:
Coin
Price
24h
7d
YTD
Market Cap
$BTC
$80,217
-0.44%
-2.27%
-8.34%
$1.61T
$ETH
$2,324
-1.85%
-3.95%
-21.67%
$283.92B
$BNB
$737.53
+0.72%
+2.05%
-14.56%
$96.99B
$XRP
$1.29
+0.80%
-0.61%
-29.86%
$81.75B
$SOL
$100.62
-1.01%
-3.31%
-19.17%
$59.34B
You can follow all of these live on our crypto prices page.
Why Is the Crypto Market Crashing Right Now?
The short answer: the trigger sits outside crypto. This week's crypto crash was a macro story first and a crypto story second. Four forces hit the market at the same time.
- Hot inflation data: September's US consumer price index came in at 3.7%, above the 3.6% the market expected. That single number killed hopes of a quick Federal Reserve rate cut and pushed Treasury yields and the dollar higher. When yields rise, risk assets with no cash flow, like crypto, lose their appeal.
- Oil and bond yields: A sharp move in the oil price fed straight into inflation expectations. Higher transport and production costs mean stickier inflation, which means a more hawkish Fed. Equities, gold and crypto sold off together on Thursday, October 22, a sign that investors were de-risking across the board rather than rotating between assets.
- ETF outflows: US spot Bitcoin ETFs saw roughly $681 million leave in the week before last and another $228.6 million last week, and Ethereum ETFs have been bleeding as well. Institutions were net sellers in the very window when the market needed a buyer of last resort.
- Leverage flush: Each macro headline forced leveraged long positions to close. Over $650 million of long bets were liquidated in one stretch earlier in the month, and a sell-off of around 4% in a single day on October 22 repeated the pattern. Forced selling begets more forced selling, which is how a 2% dip becomes a crypto crash headline.
We covered the daily moves in detail in Crypto Market Loses 4.2 Percent in a Day and Why Is Bitcoin Stuck Below $82,000?. For liquidations, dominance and the Fear and Greed index, see our charts page.
How Far Did Bitcoin Price Fall This Week?
Bitcoin price ended the week at $80,217, down 2.27% over seven days and 0.44% over the last 24 hours. The 1h move of +0.08% says it all: there is no panic, just no buyers. Bitcoin spent most of the week trapped between $80,000 and $82,000, and every push toward the upper end was met with ETF selling.
The $80,000 level is now the line in the sand. It has held on a closing basis so far, which is why the weekly loss looks mild next to the altcoins. But holding a level on fading volume is not the same as defending it. With $19.09 billion traded in 24 hours against a $1.61 trillion market cap, turnover is thin for a market this nervous.
Year to date, Bitcoin is down 8.34%. For an asset that was supposed to benefit from the ETF era, that is a sobering number, and it explains why the Bitcoin dominance narrative has lost its shine. Bitcoin is falling less than everything else, but it is still falling.
Why Did Ethereum Price Fall Harder Than Bitcoin?
Ethereum price closed the week at $2,324, down 3.95% in seven days and 1.85% in 24 hours. That is nearly double Bitcoin's weekly loss, and the gap is not an accident. Ethereum has fallen harder than Bitcoin in every leg of this crypto crash, and it is now down 21.67% year to date.
Two structural reasons explain the underperformance. First, Ethereum is traded with far more leverage on the futures market, so every liquidation wave hits ETH harder than BTC. Second, a large part of decentralised finance is collateralised with Ether. When ETH drops, loan positions get closer to their liquidation thresholds, which forces more ETH selling, which pushes the price lower still. It is a feedback loop that Bitcoin simply does not have.
Add the Ethereum ETF outflows on top, and you get a coin that is losing both its institutional bid and its on-chain floor at the same time. The $2,300 area is the level to watch. A clean break below it opens the door to a retest of $2,000, a level the market last flirted with during the spring sell-off.
Which Altcoins Fell the Most, and Which One Held Up?
- Solana price was the weakest of the large caps, down 3.31% on the week to $100.62. The psychological $100 level is now within one bad session. Solana still carries the highest beta of the majors: it rallies hardest when risk is on, and it bleeds fastest when liquidity dries up. With a 19.17% loss year to date and only $1.99 billion in daily volume, the bid under $100 is going to be tested soon.
- XRP price fell a modest 0.61% to $1.29. The weekly number looks calm, but XRP is the worst performer of the group in 2026, down 29.86% year to date. The coin has been drifting lower for months rather than crashing in a single move, and this week's 24h gain of 0.80% is a bounce inside a downtrend, not a reversal.
- BNB price was the outlier. BNB gained 2.05% over the week to $737.53, the only major in the green. Exchange-token demand tends to hold up when trading activity rises, and the volatility of the past weeks has kept Binance volumes busy. Still, BNB is 14.56% down year to date, so the green week is relative strength, not a bull market.
Is the Crypto Crash Over, or Could Crypto Prices Fall Further?
Nobody can call a bottom with confidence, but three signals will tell you which way the next leg goes.
- ETF flows: The crypto crash will not end while US spot Bitcoin and Ethereum ETFs keep bleeding. A week of net inflows would be the first real sign that institutions are back. Until then, every rally is a rally into sellers.
- The Fed and the data: The next inflation print and the Fed's tone around it matter more than any crypto-native event right now. A cooler CPI reading would ease yields and the dollar at the same time, which is exactly the relief risk assets need. Another hot number does the opposite.
- The key levels: Bitcoin at $80,000, Ethereum at $2,300 and Solana at $100 are the three lines the whole market is watching. If all three hold through the coming week, the crash is a correction that is running out of steam. If they break together, the market has further to fall, and the altcoins will lead the way down again.
The silver lining: 1h and 24h moves have shrunk to fractions of a percent. Sellers are tiring. That is usually how bottoms start, quietly and without a headline. But quiet is not the same as safe, and nothing in this week's data says the buyers are back yet.