Why Bitcoin and Altcoins Are Falling Today The crypto market had a drop, and a lot of money was lost. Bitcoin, Ethereum, and other big digital coins went down a lot because people are worried
Why Bitcoin and Altcoins Are Falling Today
The crypto market had a drop, and a lot of money was lost. Bitcoin, Ethereum, and other big digital coins went down a lot because people are worried about the economy, and big investors are selling. This made a lot of people who were using borrowed money to trade get out of the market, which made the market more unpredictable. Now, people who watch the market are looking at levels to see if this drop is just a small bump or the start of a bigger problem for the crypto market. The crypto market is still going through a lot of changes, and the crypto market is very volatile.
What Just Happened?
• Bitcoin crashed to $59,100 on June 5 — its lowest price of 2026, down 20.3% in 7 days and 27.8% in 30 days.
• CoinGlass recorded $1.75 billion in crypto liquidations in a single 24-hour window, with 351,233 traders wiped out.
• US chipmakers lost $1.3 trillion in market cap on June 5 alone — PHLX Semiconductor Index fell 10.3%, the worst since March 2020.
• Gold dropped below $4,315 on June 5 — its lowest of 2026 — after US May NFP data blew past forecasts at 172,000 vs 85,000 expected.
• Nvidia fell nearly 6%, Broadcom shed 7.5% (two-day loss: 19%), Marvell Technology plunged 16%, Micron dropped 13%.
Bitcoin ETFs bled $2.8–$3.5 billion in outflows over 10–11 trading days. Over half of all BTC supply is now at an unrealized loss.
The Bitcoin Bloodbath
Bitcoin entered its worst week of 2026 by a distance. Trading above $71,000 on June 1, the world's largest cryptocurrency hit an intraday low of $59,100 on June 5 — a fall of more than $11,900 in under four days. That placed BTC 51% below its October 2025 all-time high near $126,200 and firmly in bear market territory by every conventional measure.
The trigger that broke the market was not a single event but a cascade of overlapping pressure points that all arrived within the same two-week window. Strategy — the publicly traded Bitcoin treasury firm run by Michael Saylor — disclosed the sale of 32 BTC on June 1. The amount was negligible in dollar terms, roughly $2.5 million, but the psychological damage was disproportionate. Markets had been built on the assumption that Strategy would never sell. That assumption cracked.
Institutional exit gates followed US spot Bitcoin ETFs hemorrhaged an estimated $2.8–$3.5 billion in net outflows across 10–11 consecutive trading days since May 20. On-chain whale data tracked by CoinGlass showed entities holding between 10,000 and 10,000 BTC unloaded nearly 25,000 BTC over a single week. With sell pressure arriving simultaneously from three directions — ETFs, whales, and leveraged futures — BTC had
Coin
24H Liquidations
Direction
Bitcoin (BTC)
$560.72M ($448M longs)
▼ 19.3% (7D)
Ethereum (ETH)
$473.02M ($408M longs)
▼ Double-digit (72h)
All Other Alts
Balance of $1.75B
Across-the-board selloff
The Liquidation Cascade: How 351,000 Traders Got Wiped
The mechanics of a liquidation cascade are well-documented, but no less brutal when they arrive. When BTC broke below the $73,000 support zone on May 28, automated stop-loss orders on leveraged long positions triggered. Each forced close created fresh selling pressure, which pushed the price lower, which triggered more stops — a self-reinforcing loop that ran for days rather than hours.
By June 5, CoinMarketCap data confirmed $1.49 billion in total crypto liquidations across 24 hours. Long traders absorbed $1.49 billion of that total, 83 cents on every dollar liquidated was a bullish bet that went wrong. The single largest liquidation was a $13.31 million BTCUSDT position on Binance. At one four-hour window around 4 PM EDT, $411 million was liquidated, with longs accounting for $329 million of that sprint.
Elevated leverage in perpetual futures markets had been building throughout May. Competition between exchanges offering frictionless access to high-leverage perpetuals, combined with month-long bullish sentiment from the $82,000 range, meant position sizes were stretched heading into June. When the selling started, there was nowhere to hide.
US Stock Market: $1 Trillion Wiped in One Day
Broadcom's Earnings Started the Fire
The proximate cause of the US equity selloff was Broadcom's quarterly earnings release. The custom AI chip designer, one of the most hyped beneficiaries of the artificial intelligence infrastructure build-out, reported strong revenue figures but reiterated rather than raised its 2026 full-year guidance. For a stock priced to perfection, that was enough.
Broadcom fell roughly 15% on the day of the earnings release. The ripple arrived 24 hours later. On June 5, every major chipmaker traded like the AI bubble was deflating simultaneously. The PHLX Semiconductor Index fell 10.3% — its steepest single-session loss since March 2020, the early days of the COVID-19 shock.
Stock / Index
June 5 Move
Context
PHLX Semiconductor Index
−10.3%
Worst since March 2020
Nasdaq Composite
−4.2%
Worst since April 2025
S&P 500
−2.6%
Dow Jones
−1.4% (−621 pts)
Day after record high
NVIDIA (NVDA)
−6.93%
Below $5T market cap
Broadcom (AVGO)
−7.5% (2-Day: −19%)
Guidance disappointment
Marvell Technology
−16%
Micron Technology (MU)
−13%
Intel & AMD
~−11% each
Cisco Systems
−6.35%
Dow's biggest laggard
Total Chip Sector Loss
$1.3 Trillion
Single session, June 5
Gold & Silver: Precious Metals Under Pressure
Gold entered June 2026 already under strain, trading below the $4,500 psychological level. On June 5, the US Bureau of Labor Statistics released May nonfarm payroll data that blew past every forecast — 172,000 jobs added against an expected 85,000. The unemployment rate held at 4.3%, and annual wage growth came in at 3.4%, broadly in line with estimates.
A labor market running this hot forces markets to reprice Federal Reserve policy. Investors who had been counting on rate cuts repriced quickly toward rate holds or even a potential hike before year-end. The USD strengthened. Gold, which moves inversely to real interest rate expectations, broke below $4,320 — hitting its lowest point of 2026 and heading for a weekly decline approaching 4%.
Gold / Silver Data Point
Value
Gold Price (June 5, 2026)
$4,320 — 2026 Low
Weekly Gold Decline
~−5%
NFP Actual vs Expected
172,000 vs 85,000 forecast
Fed Rate Hold Probability
Overwhelming (June FOMC)
June 8 Gold Range Forecast
$4,320 – $4,509
Broader Jan 2026 Context
Gold and Silver erased ~$7T in the Jan 30 crash (separate event)
Context matters here: the January 30, 2026, precious metals crash — when gold plunged 9% to $4,895 and silver collapsed 35% in a single session, erasing an estimated $7 trillion in combined market value — was a separate event driven by an unexpectedly hawkish pick for the next Federal Reserve governor. The June selloff is distinct in character: a labor-data-driven repricing, not a positioning panic. That said, gold remained structurally below key support at $4,500 heading into the weekend.
Why Nvidia Fell — And What the 11-12% Move Actually Means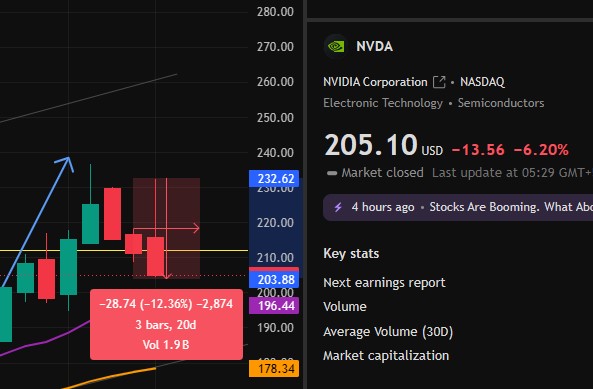
NVIDIA entered the week of June 2 as a $5 trillion company. It exited below that threshold. The June 5 move of ~6% on the day followed Thursday's broader chip sector retreat, which itself was triggered by Broadcom's earnings. Over the two-session window, Nvidia shed enough market cap to rank among the largest short-term value destructions in US stock market history.
The underlying driver is investor anxiety about the AI capex cycle sustainability. Broadcom's guidance disappointment signalled that hyperscaler demand for custom AI chips — the sector's fastest-growing revenue line — was not accelerating at the pace baked into valuations. If the biggest AI chip designer says demand is merely in line rather than ahead of expectations, every other AI play gets repriced simultaneously.
NVIDIA's situation is structurally different: its data center revenue continues to grow, and its CUDA software moat remains intact. But with a $5 trillion valuation, the market needs perfection on every datapoint. A single datapoint that is merely good rather than exceptional sends the stock down 5–6% in hours. That is not a company in trouble. That is a company priced with zero room for nuance.
Nvidia Metric
Status
Stock Price (June 5 Close)
~$207 (down from $218+ range)
Market Cap Post-Drop
Below $5 Trillion
2-Day Chip Sector Loss
>10% (PHLX)
Broadcom 2-Day Loss
−19%
Trigger
Broadcom guidance miss + NFP rate-hike fear
YMYL DISCLAIMER — For Informational Purposes Only
This report is produced by CoinGabbar for informational and educational purposes only. Nothing in this document constitutes financial advice, investment advice, trading advice, or any other form of recommendation. Cryptocurrency markets are highly volatile and speculative. Past market behavior is not indicative of future performance. All data cited is sourced from publicly available market data providers as of June 5–6, 2026, and is subject to revision. Readers should conduct their own independent research and consult a qualified financial advisor before making any investment decisions. CoinGabbar, its authors, and its reviewers hold no liability for financial losses arising from the use of this report.