Ethereum, Bitcoin, and Cardano have recovered from yesterday’s lows, but those rebounds face an important test today. Each asset has returned toward a familiar trading range, where the next m
Ethereum, Bitcoin, and Cardano have recovered from yesterday’s lows, but those rebounds face an important test today. Each asset has returned toward a familiar trading range, where the next move could determine whether the recovery continues or loses ground.
This crypto price prediction for today, October 16, examines the supplied price updates and indicator readings. The picture is mixed across all 3 assets, with recovery attempts still under pressure from weaker underlying trends.
Ethereum Price Returns To Its Trading Range After Losing Support
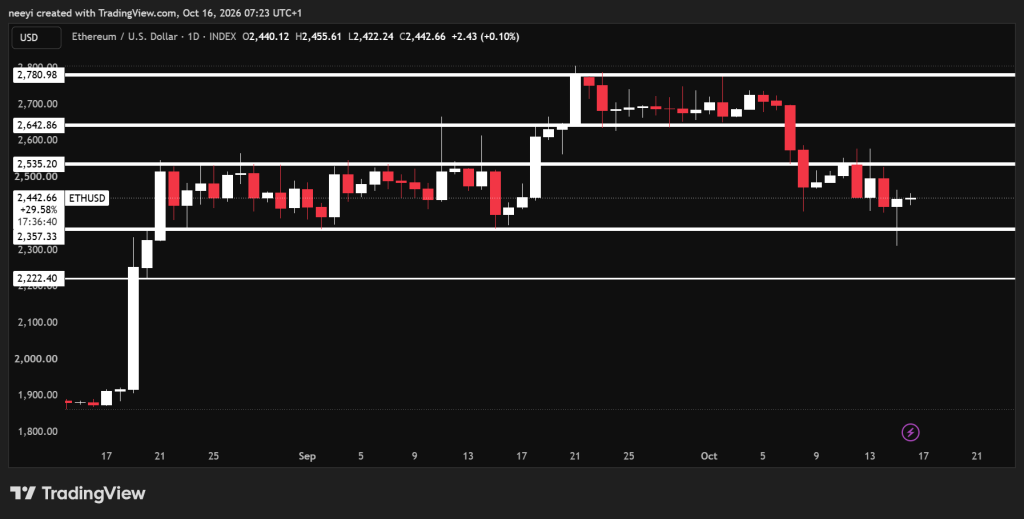
Ethereum price bounced from around $2,300 yesterday after a break below support near $2,360. That recovery brought ETH back inside the $2,360 to $2,540 zone that has contained much of its price action since October 8.
The return above $2,360 matters because yesterday’s breakdown failed to keep Ethereum below the range. However, a recovery into familiar territory does not automatically establish a bullish reversal. Buyers still need to defend the lower boundary and challenge resistance.
ETH Price Chart / TradingView.com
A look at the Ethereum chart shows $2,360 as the immediate support to monitor. Another loss of this level could expose $2,300 again, followed by potential support around $2,200. A sustained break above $2,540 would strengthen the case for $2,650.
Ethereum Indicators Show A Recovery Without Clear Bullish Control
Ethereum’s RSI of 45.583 remains below the midpoint of 50. Selling pressure has eased enough to allow a rebound, but the reading does not establish buyer dominance. ETH could therefore remain vulnerable near resistance.
The Stochastic reading of 60.011 gives the recovery some support. Price has improved relative to its recent range, which fits the bounce from $2,300. However, this reading alone cannot confirm a breakout above $2,540.
The MACD reading of −29.430 indicates that the underlying trend remains weak. Ethereum’s rebound has therefore developed against a negative trend reading. A single MACD value cannot establish whether that weakness is improving without earlier readings or signal line data.
Bull/Bear Power of −9.1814 also points to continued bearish pressure. Buyers have recovered lost territory, but sellers retain enough influence to challenge the rebound.
Indicator
Value
Action Explained
RSI (14)
45.583
Momentum remains below clear bullish strength.
Stochastic (9,6)
60.011
Recent price recovery supports further upside attempts.
MACD (12,26)
−29.430
The underlying trend remains under bearish pressure.
Bull/Bear Power (13)
−9.1814
Sellers retain influence despite the recent rebound.
Ethereum Price Prediction For Today
- Bullish Scenario: A sustained break above $2,540 could open a move toward $2,650. Further upside would require continued buying strength.
- Neutral Scenario: Ethereum could remain between $2,360 and $2,540 if neither side secures a decisive breakout.
- Bearish Scenario: A loss of $2,360 could expose $2,300 again. Continued selling could then bring $2,200 into view.
Bitcoin Price Reclaims $82,100 As Range Boundaries Guide The Outlook
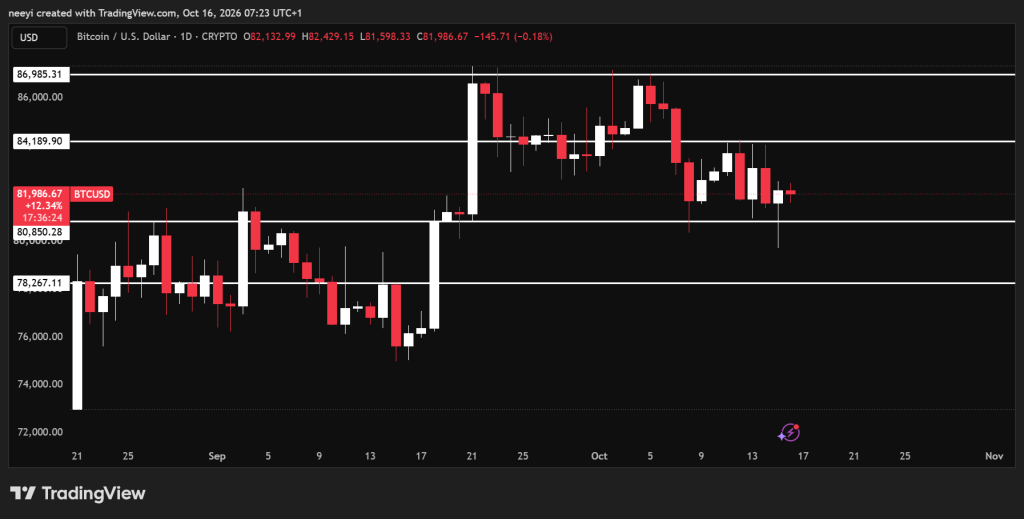
Bitcoin price recovered from around $79,700 to approximately $82,100 in the supplied update. That rebound returned BTC inside the $80,800 to $84,200 range, but the recovery still needs confirmation near its upper boundary.
The immediate question is whether Bitcoin can hold $80,800 during another pullback. A successful defense would preserve the range and allow another attempt toward $84,200.
BTC Price Chart / TradingView.com
A failure at support would change that outlook. Bitcoin could revisit yesterday’s low before testing $79,000 or $78,000. Conversely, a sustained break above $84,200 could create room for a move toward $86,000.
Bitcoin Indicators Show Limited Strength Behind The Rebound
Bitcoin’s RSI of 45.424 remains below 50. The recovery to $82,100 has improved price, but momentum has not reached a level associated with clear bullish control.
The Stochastic reading of 52.306 offers a relatively balanced picture. Bitcoin has recovered from its low without reaching an especially strong position within its recent range. Continued consolidation would fit that reading.
The MACD value of −391.294 indicates that broader momentum remains negative. This supports caution about treating the rebound as an established reversal. The reading does not independently predict another decline, but it shows that the recovery faces an unresolved obstacle.
Bull/Bear Power of −244.8664 reinforces that concern. Sellers continue to exert pressure despite Bitcoin’s recovery, which makes the next test of support particularly relevant.
Indicator
Value
Action Explained
RSI (14)
45.424
Momentum remains weaker than clear bullish territory.
Stochastic (9,6)
52.306
Recent price positioning offers no decisive advantage.
MACD (12,26)
−391.294
Negative trend momentum still challenges the recovery.
Bull/Bear Power (13)
−244.8664
Bearish pressure persists despite the price rebound.
Bitcoin Price Prediction For Today
- Bullish Scenario: A sustained move above $84,200 could support an extension toward $86,000 before today ends.
- Neutral Scenario: Bitcoin could continue between $80,800 and $84,200 as the rebound encounters resistance.
- Bearish Scenario: A break below $80,800 could expose $79,700 and $79,000. Stronger selling could extend the decline toward $78,000.
Cardano Price Rebounds Toward $0.23 As Buyers Attempt Further Recovery
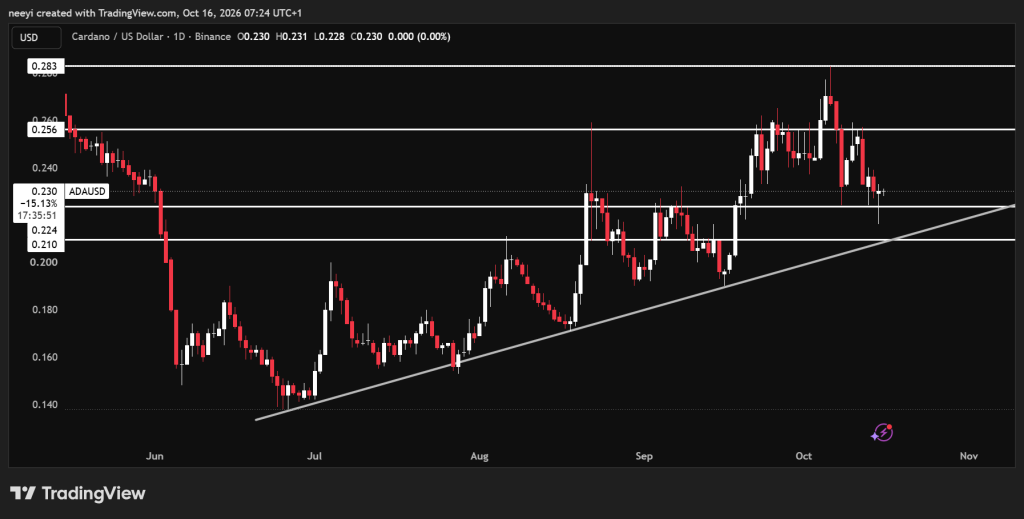
Cardano price bounced from approximately $0.216 yesterday and returned toward $0.23. ADA now has an opportunity to extend its recovery, provided support around $0.224 survives another test.
ADA Price Chart / TradingView.com
The relevant trading range extends from $0.224 to $0.256. Cardano remains closer to its lower boundary, so the rebound still has considerable ground to cover before a bullish breakout becomes possible.
A look at the Cardano chart shows $0.256 as the resistance that buyers need to overcome. A sustained break could expose $0.28, although that would require a substantial extension from the supplied price.
Cardano Indicators Support A Bounce But Leave The Trend Vulnerable
Cardano’s RSI of 42.929 shows weaker momentum than the readings supplied for Ethereum and Bitcoin. ADA has recovered, but buyers have not established clear control.
The Stochastic reading of 62.286 provides a more constructive near term signal. It supports the possibility that the rebound continues within the range, although it cannot confirm a reversal independently.
The MACD value of −0.005 keeps the underlying trend assessment negative. Cardano’s recovery therefore needs stronger price confirmation before the bearish backdrop can be considered resolved.
Bull/Bear Power of −0.0029 also indicates continued seller influence. A failure to defend $0.224 would give that weakness greater practical importance.
Indicator
Value
Action Explained
RSI (14)
42.929
Momentum remains weak despite the recent recovery.
Stochastic (9,6)
62.286
Recent price improvement supports another recovery attempt.
MACD (12,26)
−0.005
Underlying trend momentum remains below neutral territory.
Bull/Bear Power (13)
−0.0029
Sellers maintain pressure beneath the recovery attempt.
Cardano Price Prediction For Today
- Bullish Scenario: A sustained break above $0.256 could open a path toward $0.28 if buying strength expands.
- Neutral Scenario: ADA could trade between $0.224 and $0.256 as its recovery meets continued resistance.
- Bearish Scenario: A break below $0.224 could expose $0.216 again, followed by a potential decline toward $0.21.
FAQs
Can Cardano ADA reach $10?
Yes, Cardano (ADA) can theoretically reach $10, but mainstream financial and algorithmic models consider it highly improbable in the near to medium term.
Which is better, XRP or Cardano?
Whether XRP or Cardano is better depends on your investment goals, as the two networks serve completely different purposes.
Subscribe to our YouTube channel for daily crypto updates, market insights, and expert analysis.
The post Crypto Price Prediction For Today, October 16: Ethereum (ETH), Bitcoin (BTC), Cardano (ADA) appeared first on CaptainAltcoin.