Crypto whales have been trimming their coins, and the numbers are hard to miss. Over the past week, large holders sold about 30,000 BTC, worth roughly $2.52 billion. The wider market stayed q
Crypto whales have been trimming their coins, and the numbers are hard to miss. Over the past week, large holders sold about 30,000 BTC, worth roughly $2.52 billion.
The wider market stayed quiet. Total crypto market value slipped 0.24% to near $2.87 trillion. Bitcoin fell 0.13% and traded below $84,000. XRP lost 1.77% and sits below $1.48.
Crypto analyst Ali shared the whale data on X. His point was simple: prices moved sideways, but big wallets did not all act the same way.
Are Whales Buying or Selling Bitcoin Right Now?
For Bitcoin, the answer is selling. Bitcoin whales cut their combined holdings by about 30,000 BTC in one week.
That is around $2.52 billion at current prices. It suggests large holders may be lowering their exposure.
The data does not say why. They could be taking profit, moving coins, or just rebalancing. Nobody outside those wallets knows for sure.
Here is how the three big coins compared:
Asset
Whale Move (Past Week)
Approx. Value
Bitcoin (BTC)
Down about 30,000 BTC
$2.52 billion
Ethereum (ETH)
Up about 60,000 ETH
$162 million
XRP
Flat near 3.90 billion XRP
No major change
What Are Ethereum Whales Doing?
Ethereum whales are buying. They added roughly 60,000 ETH over the same week, worth about $162 million.
It is the only one of the three assets with clear whale buying. Price still sits just below $2,700, so the buying has not lifted it much yet.
Are XRP Whales Buying or Holding?
XRP whales are mostly holding. Their combined balance stayed near 3.90 billion XRP all week, with no big change.
Ali sums it up this way: Bitcoin whales are reducing, Ethereum whales are buying, and XRP whales are waiting. That split could matter as the market looks for its next move.
How Much Crypto Was Liquidated in the Last 24 Hours?
About $294.04 million in positions were wiped out in 24 hours. Long and short traders lost almost the same amount.
A total of 80,541 traders were liquidated. The biggest single order was a $6.91 million BTC-USDT position on HTX.
Category
Liquidated (24h)
Total
$294.04 million
Long positions
$147.83 million
Short positions
$146.21 million
Bitcoin (BTC)
$100.60 million
Ethereum (ETH)
$51.41 million
ZEC
$14.63 million
SOL
$12.18 million
XRP
$6.29 million
QNT
$5.96 million
Bitcoin took the largest share. Even so, the even long-and-short split points to a choppy, two-way market rather than a one-sided move.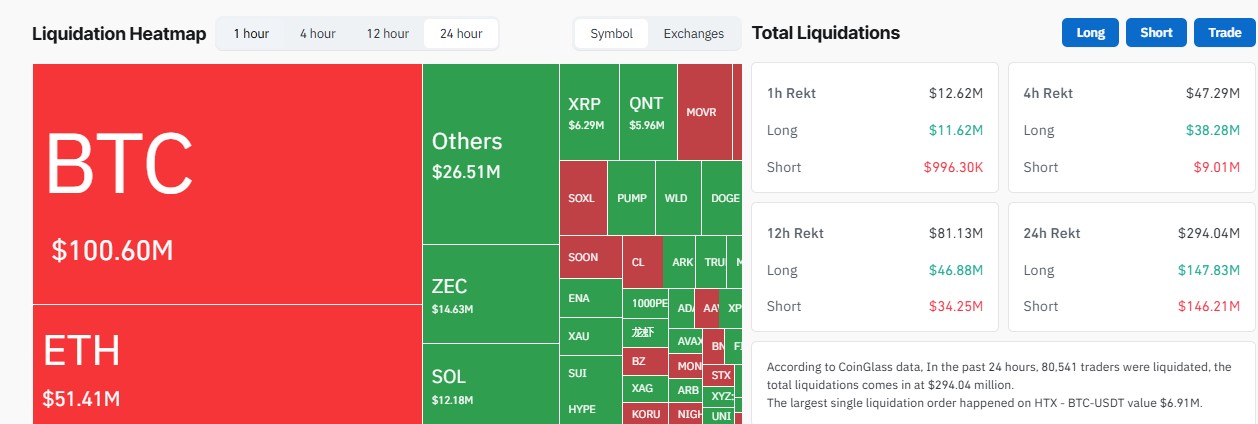
Are Bitcoin ETFs Seeing Inflows or Outflows?
Outflows, at least for Bitcoin and Ethereum. According to SoSoValue, US spot BTC ETFs lost a net $149 million on September 30 (Eastern Time). None of the 12 funds posted inflows.
US spot Ethereum ETFs saw a net outflow of $59.58 million. All 10 funds showed zero inflows.
XRP spot ETFs paused. They took in $79.36 million over the previous five trading days, then recorded $0.00 on September 29 and 30.
Spot ETF
Latest Flow
Note
Bitcoin (12 funds)
-$149 million
No fund had inflows
Ethereum (10 funds)
-$59.58 million
No fund had inflows
XRP
$0.00 (Sept 29 and 30)
$79.36 million in the prior 5 days
XRP funds still show total net inflows near $1.79 billion. Net assets are around $1.68 billion. This looks more like a short rest after several positive days.
When ETF money leaves while Bitcoin whales sell, it is fair to ask if demand is cooling. One week of data cannot settle that.
Will Bitcoin Drop After the 2026 US Midterm Elections?
Nobody can say for sure. But history gives traders something to watch. The US midterm elections are on November 3, 2026.
After the 2010, 2014, 2018, and 2022 midterms, Bitcoin fell 72%, 65%, 52%, and 27%. That does not prove the votes caused the drops. The pattern is just hard to ignore.
Fourth-quarter results look mixed but mostly weak:
Year
Midterm Drop
Q4 Result
2010
-72%
+391%
2014
-65%
-16.70%
2018
-52%
-42.16%
2022
-27%
-14.75%
Q4 has begun, so some volatility would not be a surprise.
One level the analyst flags is the short-term holder cost basis, near $73,000. In past bull markets, this level often held during big pullbacks. Some traders treat it as a possible support zone, though there is no promise it will hold again.
What Are the Key Price Levels for Ethereum and XRP?
Ethereum.ETH looks like it is forming a bull flag on the lower timeframes.
Support to watch: $2,640
An hourly close above $2,700 could confirm a breakout
A confirmed move could open the path toward $3,000
XRP.XRP seems to be building a symmetrical triangle on the hourly chart.
Key level: $1.54
An hourly close above it would confirm the breakout
That pattern could point to a rise of about 10%, near $1.70
Chart patterns fail often. Both setups need a real close above the levels, not just a quick spike.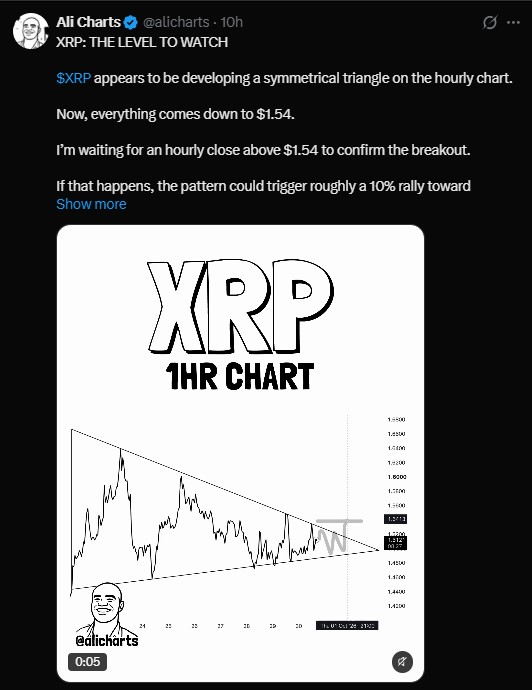
What Should Traders Watch Next?
The whale split is the main story. Bitcoin whales are selling, Ethereum whales are buying, and XRP whales are waiting.
Add ETF outflows and the November midterms, and the next few weeks could get bumpy. Or the market may keep drifting sideways. Both are possible.
Disclaimer
This article is for information only. It is not financial, investment, legal, or tax advice. Crypto assets are volatile, and you can lose some or all of your money. Past performance does not predict future results. Chart patterns and price levels are not guarantees. Do your own research and speak with a licensed financial advisor before you make any decision.