Key Highlights Decentraland (MANA) is trading near $0.0727, up 12% over the past month. Whale transactions surged 833%, the biggest weekly increase among tracked crypto projects. A Symmetrica
Key Highlights
- Decentraland (MANA) is trading near $0.0727, up 12% over the past month.
- Whale transactions surged 833%, the biggest weekly increase among tracked crypto projects.
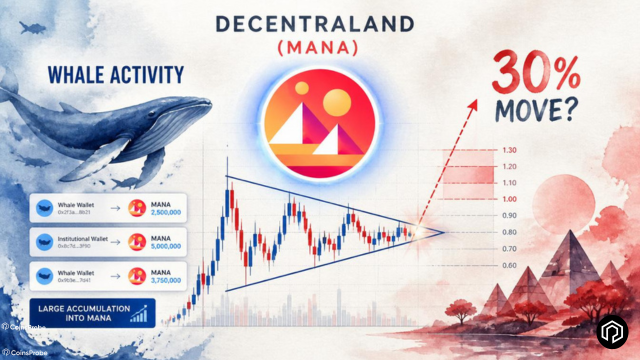
- A Symmetrical Triangle is forming, signaling a potential 30% move in either direction.
- The recent Aster DEX perpetual futures listing has added fresh trading interest to MANA.
Decentraland is sending three simultaneous signals this week — on-chain whale accumulation at record pace, a new leveraged trading venue, and a technical pattern coiling for a significant directional move. Whether that move is up or down remains the open question, but the preconditions for significant volatility are clearly building.
MANA Price at a Glance — July 10, 2026
Decentraland (MANA) is currently trading at $0.07266, with a market capitalization of approximately $144.31 million.Over the past week, MANA has gained +2.59%, while the 30-day performance shows a stronger +12.25% increase. The token has been showing signs of renewed interest amid broader market movements and specific developments around the project.
 Decentraland (MANA) Price on 10 July 2026/Source: Coinmarketcap
Signal 1 — 833% Surge in Whale Transactions
The most striking data point in today’s analysis comes from Santiment — which confirms that Decentraland recorded the highest weekly increase in whale transactions ($100K+) among all tracked projects in its dataset.
The number itself is extraordinary: +833% in large on-chain activity in a single week. To put this in context — this is not MANA appearing in a list of projects with elevated whale activity. It is topping that list with an 833% week-over-week increase — meaning it showed more relative growth in large transactions than any other tracked token during this period.
What this tells us: Whale transactions of $100K+ represent deliberate, large-scale capital movement — institutional participants, funds, and sophisticated individual holders making intentional position changes. An 833% week-over-week increase is not random noise — it reflects a genuine and significant shift in how large holders are engaging with MANA specifically during this period.
The reason behind this shift is not definitively confirmed on-chain — but the convergence with the Aster DEX listing, the technical pattern forming on the chart, and MANA’s 30-day price recovery suggest multiple catalysts may be attracting large-holder attention simultaneously.
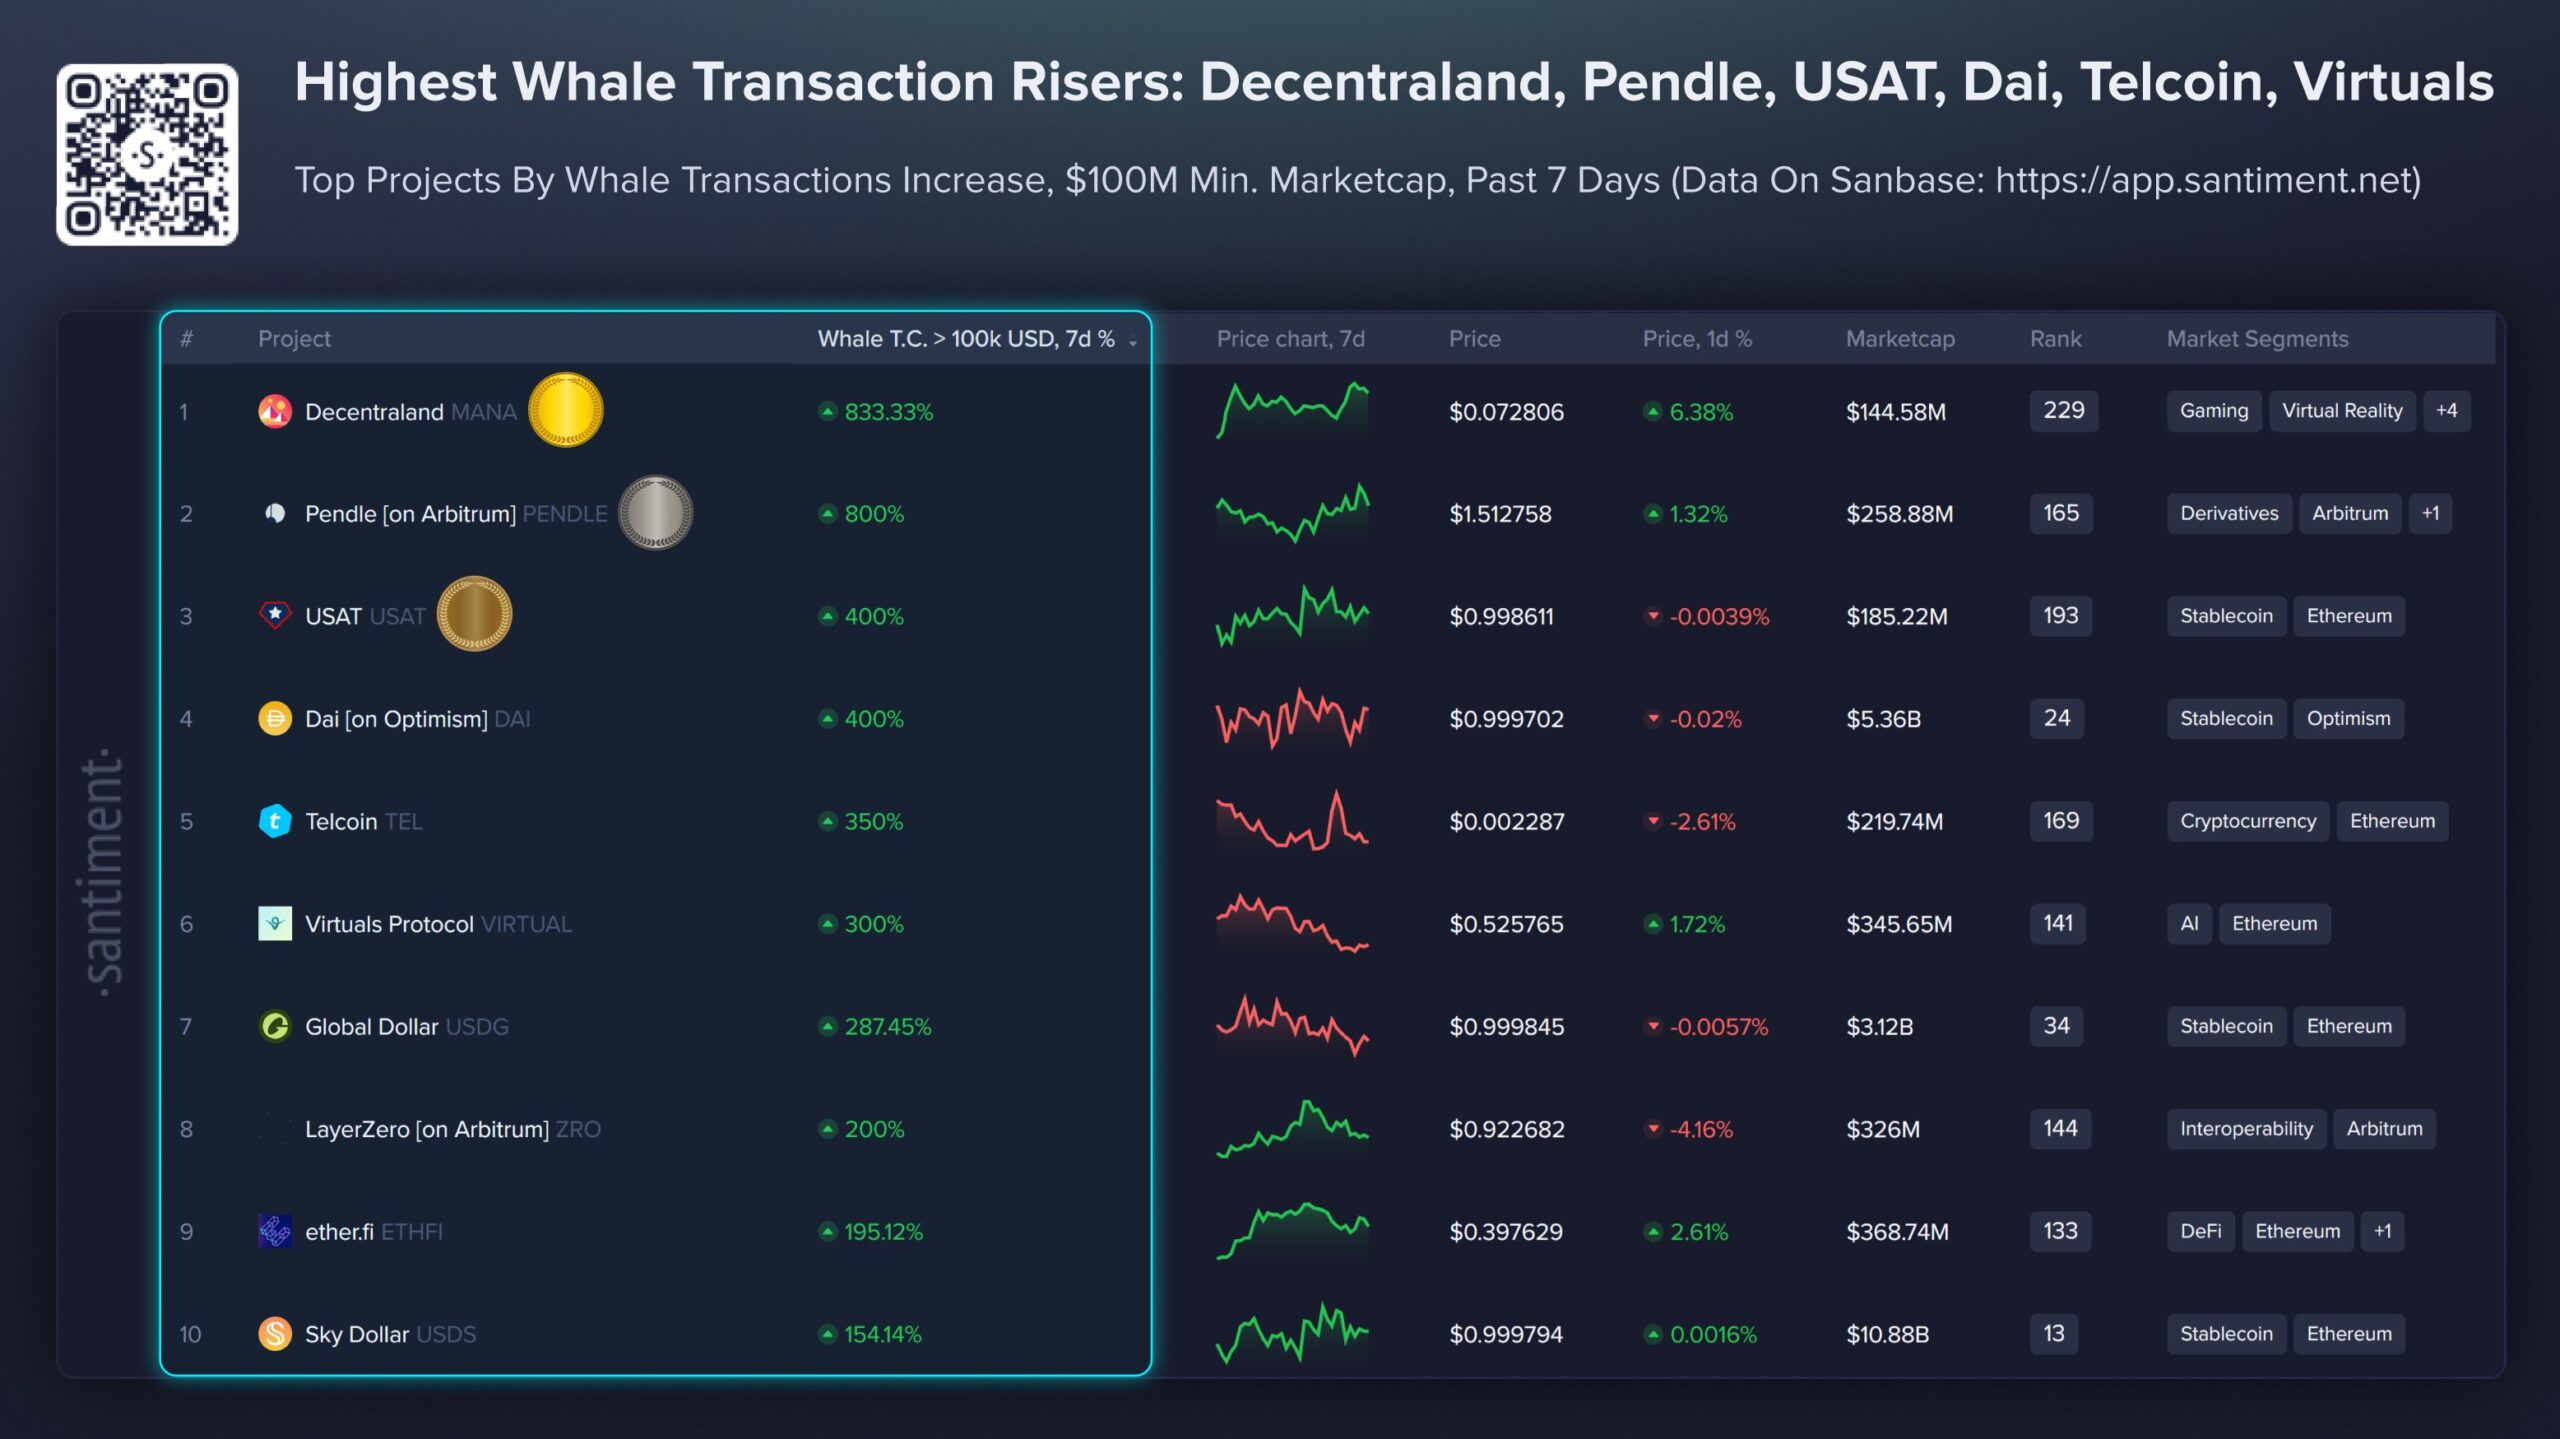 Top 10 projects seeing the highest weekly rises/Source: @SantimentData (X)
Signal 2 — Aster DEX Lists MANA Perpetual Futures
On July 5, 2026, decentralised perpetual exchange Aster DEX announced the listing of $MANA perpetual futures with up to 5x leverage — alongside $IDOL.
As a platform we have covered extensively — including Aster DEX’s 198% buyback and burn upgrade — Aster DEX has been one of the fastest-growing Perp DEX platforms in 2026, currently ranked among the top three by weekly volume. A new listing on Aster carries genuine reach to the platform’s active perpetual trading base.
The incentive structure: Aster is also offering 1.2x trading points for MANA perpetual traders until July 11, 23:59 UTC — a time-limited incentive that typically concentrates trading activity and volume in the opening week of a new listing. For short-term traders watching MANA’s technical setup, this creates both additional liquidity and an incentivised trading window that coincides precisely with the current technical breakout period.
The listing adds a leveraged dimension to MANA’s volatility profile — with 5x leverage available, both bullish breakout moves and bearish breakdowns will be amplified beyond what the spot market alone would produce.
 MANA and IDOL Tokens Listed on Aster Dex PERP/Source: @Aster_DEX (X)
Signal 3 — Symmetrical Triangle on the 4-Hour Chart
On the 4-hour chart, MANA has formed a clear Symmetrical Triangle — one of the most well-defined consolidation patterns in technical analysis. The pattern is characterised by two converging trendlines — a descending upper resistance and an ascending lower support — that squeeze price action progressively tighter until a breakout in one direction occurs.
 Decentraland (MANA) 4H Chart-Coinsprobe/Source: Tradingview
The pattern’s boundaries:
TrendlineKey Price PointsUpper resistanceConnecting highs near $0.0819 and $0.0797Lower supportConnecting lows near $0.0612 and $0.0667Current price~$0.0727–$0.0734
The measured move — ±30% in either direction:
The standard measured move for a symmetrical triangle projects the height of the pattern’s widest point above or below the breakout level — in MANA’s case, suggesting a ~30% move in whichever direction the breakout occurs.
Bullish scenario — A decisive breakout above the upper resistance trendline targets approximately $0.095–$0.0986 — representing roughly +30% upside from current levels.
Bearish scenario — A breakdown below the lower support trendline pushes MANA toward approximately $0.050 — representing roughly -30% downside.
The symmetrical triangle does not inherently favour either direction — it simply identifies that a significant move is building and provides the level-based triggers that confirm which direction is resolving. Traders are watching specifically for a strong 4-hour or daily close outside the triangle as the confirmation signal, rather than an intraday wick that quickly reverses back inside the pattern.
hy Three Signals Together Create an Elevated Volatility Setup
The specific combination of signals present in MANA right now is worth examining as a whole rather than individually.
The 833% whale transaction surge confirms large-holder positioning is actively underway — but whale activity can precede moves in either direction. Whales accumulating in anticipation of a breakout and whales building short positions ahead of a breakdown can look similar in raw transaction volume data.
The Aster DEX perpetual listing with 5x leverage adds fuel — a new leveraged venue concentrates speculative interest and amplifies moves in whichever direction the market chooses, while the 1.2x trading point incentive through July 11 ensures that concentration happens specifically during the current technical breakout window.
The Symmetrical Triangle provides the framework — a defined range with clear breakout and breakdown triggers that give traders actionable levels rather than requiring pure directional conviction.
Together: large capital is moving, a new leveraged trading venue is live, and a well-defined technical pattern is coiling for a ±30% resolution. The setup is not inherently bullish or bearish — it is a high-volatility convergence that makes MANA worth watching closely for the directional resolution.
Bottom Line
Decentraland’s combination of an 833% whale transaction surge — the highest weekly increase among all tracked tokens on Santiment — a Symmetrical Triangle targeting ±30%, and a new Aster DEX perpetual listing with 5x leverage creates one of the more complete volatility setups in the current altcoin market.
The directional question remains open — the triangle resolves either upward toward $0.095–$0.0986 or downward toward $0.050. But the preconditions for a significant, leverage-amplified move in whichever direction the market chooses are clearly in place. Watch for a confirmed 4-hour or daily close outside the triangle boundaries — that close, with volume, will be the most reliable signal of which scenario is playing out.
Disclaimer: The views and analysis presented in this article are for informational purposes only and reflect the author’s perspective, not financial advice. Technical patterns and indicators discussed are subject to market volatility and may or may not yield anticipated results. Investors are advised to exercise caution, conduct independent research, and make decisions aligned with their individual risk tolerance.
Read Also: Ethereum (ETH) Rebounds From Critical $1,580 Level — Could this Signal Trigger Next Rally?