The DeXe price prediction for 2026 is getting a lot of attention right now, and honestly, it's not hard to see why. DEXE just jumped more than 22% in a single day while Bitcoin dropped over 6
The DeXe price prediction for 2026 is getting a lot of attention right now, and honestly, it's not hard to see why.
DEXE just jumped more than 22% in a single day while Bitcoin dropped over 6% and Ethereum fell over 8%. That kind of divergence doesn't happen by accident. So what's actually going on here?
What Is DeXe and Why Does It Matter
it is a governance and DAO infrastructure protocol built on the Ethereum blockchain. It gives decentralized organizations the tools to manage treasuries, run votes, and respond to market conditions fast.
It's not a meme coin. It's not a quick narrative play. It's a protocol built around one idea: that decentralized governance needs to actually work, not just exist on paper.
Why DEXE Is Moving Up While BTC and ETH Fall
This is where it gets interesting. BTC and ETH are getting hit by liquidation cascades and macro pressure right now.
Big players are exiting positions, and that selling drags the majors down hard. But It doesn't live in that same derivatives ecosystem. It's not caught in the same leverage traps.
And there's something else happening.
DeXe posted a tweet during the sell-off that basically said crashes don't hurt protocols with fast governance; they expose the ones without it.

That kind of messaging during a market panic is smart positioning. Traders noticed.
Basically, when BTC bleeds, rotation money sometimes flows into low-cap tokens with a strong narrative. DEXE had the narrative ready.
DAO Studio launches, new partnerships, and a clear utility story in the decentralized governance niche. That's a rare combination on a red day.
The Numbers: What the Data Shows Today
Field
Data
Token Name
DeXe
Ticker Symbol
DEXE
Blockchain
Ethereum
Current Price
$21.87
Today High
$24.299
Today Low
$18.023
RSI Level
78.04
Token Type
Governance / DeFi
Source: Data By Coingecko
The chart has already made up its mind.
The DEXE daily chart on TradingView is clean. It is inside an ascending channel, and right now it's pushing against the upper boundary.
Price closed above the 20, 50, and 200 EMAs—all of them. That's not a noisy signal. That's a trend with real structure behind it.
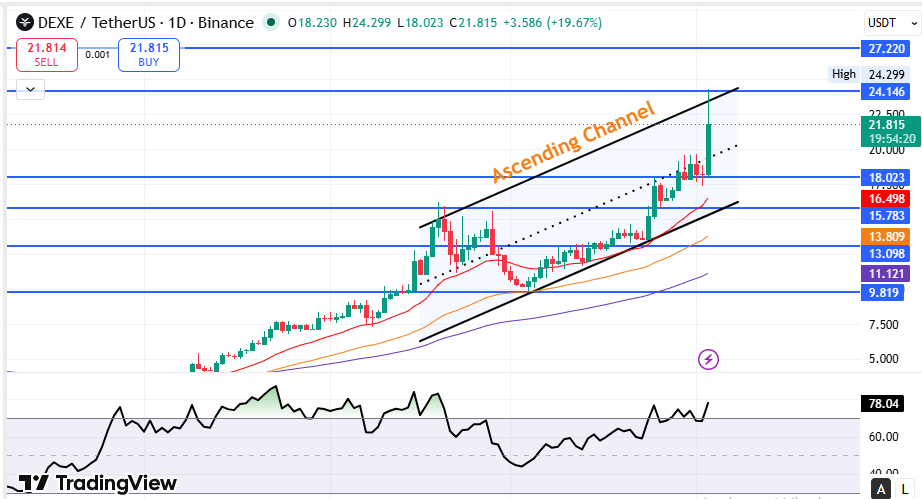
RSI is sitting at 78.04. That's overbought territory. Overbought doesn't mean sell. But it does mean the easy money has already moved.
A coin can stay overbought during a strong trend. It can also retrace hard without warning.
When we look at the candle pattern near that upper channel boundary, the question isn't whether DEXE is bullish.
It clearly is. The question is whether it can break above the channel and hold, or whether it pulls back to find support first before the next leg up.
Three Roads Could Take From Here
Worst case: It gets rejected at the upper channel boundary, RSI cools off sharply, and Bitcoin continues its downtrend. Price slides back toward the $13 to $15 range. Broader market conditions drive this outcome, not anything specific to itself.
Base Case: DEXE consolidates between $18 and $22, builds a base above the EMAs, and makes another attempt at the $24 resistance zone. If BTC stabilizes, It pushes into the $24 to $27 range through the second half of 2026.
Best Case: A clean breakout above $24.15 with strong volume, followed by a retest and hold. From there, the $27.22 level becomes the next target. If DAO adoption picks up and the broader DeFi narrative strengthens, It could push well beyond that.
Scenario
Price Range
What Triggers It
Worst Case
$13 to $15
BTC crash, RSI breakdown
Base Case
$24 to $27
Consolidation, then breakout
Best Case
$27 and above
Volume breakout, DeFi rotation
The Only Three Numbers That Matter Right Now
Immediate supportis at $18.023. That's where buyers stepped in hard today, and it aligns with the lower boundary of the ascending channel. It's the first line of defense on any pullback.
The first resistance above the current price is $24.146. It already touched this level as today's high. A daily close above it would be a strong signal that the breakout is real and not just a wick.
The invalidation zone sits around $13.098. A drop below this level would break the channel structure entirely and change the whole picture. Below that level, the bullish thesis gets much harder to defend.
Smart Money Is Watching This One Level Closely
The RSI at 78 is the most watched number on the chart today.
Analysts tracking the daily timeframe are watching the DeXe price prediction closely, specifically whether the price can close above $24.15 on a daily candle, not just spike through it intraday
A weekly close above that level would confirm momentum is real.
There's also something bigger to track beyond the chart. If BTC finds a floor and stabilizes, capital that rotated into DEXE during the selloff might not rotate back. That's the scenario bulls are quietly hoping for.
But if BTC continues lower, even a strong chart structure can buckle under market-wide pressure.
The setup looks more bullish than most are giving it credit for. But risk is still real.
Disclaimer: This article is for educational purposes only and does not constitute financial advice. Crypto markets are highly volatile. Consult your investment advisor before making investment decisions.