Here is what is documented: Dogecoin trades at $0.0778 on Tuesday afternoon, 13.9 percent below its 200-day average of $0.0903 and 7.4 percent below its 50-day average of $0.0840. Our own ass
Here is what is documented: Dogecoin trades at $0.0778 on Tuesday afternoon, 13.9 percent below its 200-day average of $0.0903 and 7.4 percent below its 50-day average of $0.0840. Our own assessment follows further down: the gap is wide, but it was wider on more than every second day this year.
The price sits 13.9 percent below the 200-day average
Tuesday afternoon's figures, taken from CoinGecko: $0.077835, up 0.5 percent over 24 hours, a daily high of $0.0781 and a daily low of $0.0766. Over seven days the coin is down 2.4 percent, over 30 days down 21.2 percent. Market value stands at $12.18 billion, daily turnover at $373 million.
The real finding is not in the daily price but in the distance to the two lines our price chart shows. The 200-day average stands at $0.0903, the 50-day average at $0.0840. The price is below both, and the shorter line sits below the longer one. That was the case on all 167 days for which the 200-day average can be calculated from our time series since October 28, 2025. There has been no upward cross in that window.
On 94 of 166 days the gap was even wider
We recalculated the distance between price and 200-day average for every single day of that window. On 94 of the 166 preceding days the price sat proportionally further below the line than it does today. The widest gap of the year came on July 1, 2026, at 33.9 percent. Today's 13.9 percent is therefore not an outlier but the normal state of a market that has been falling for twelve months.
That calculation comes from our own analysis of the daily price series and is published nowhere else. The finding shifts the view of the situation: anyone who reads the distance to the yearly line as a reason to buy has been able to read it on Dogecoin for months, without a turn ever following from it. For an asset in a downtrend, a wide gap to the downside is the rule and not the exception.
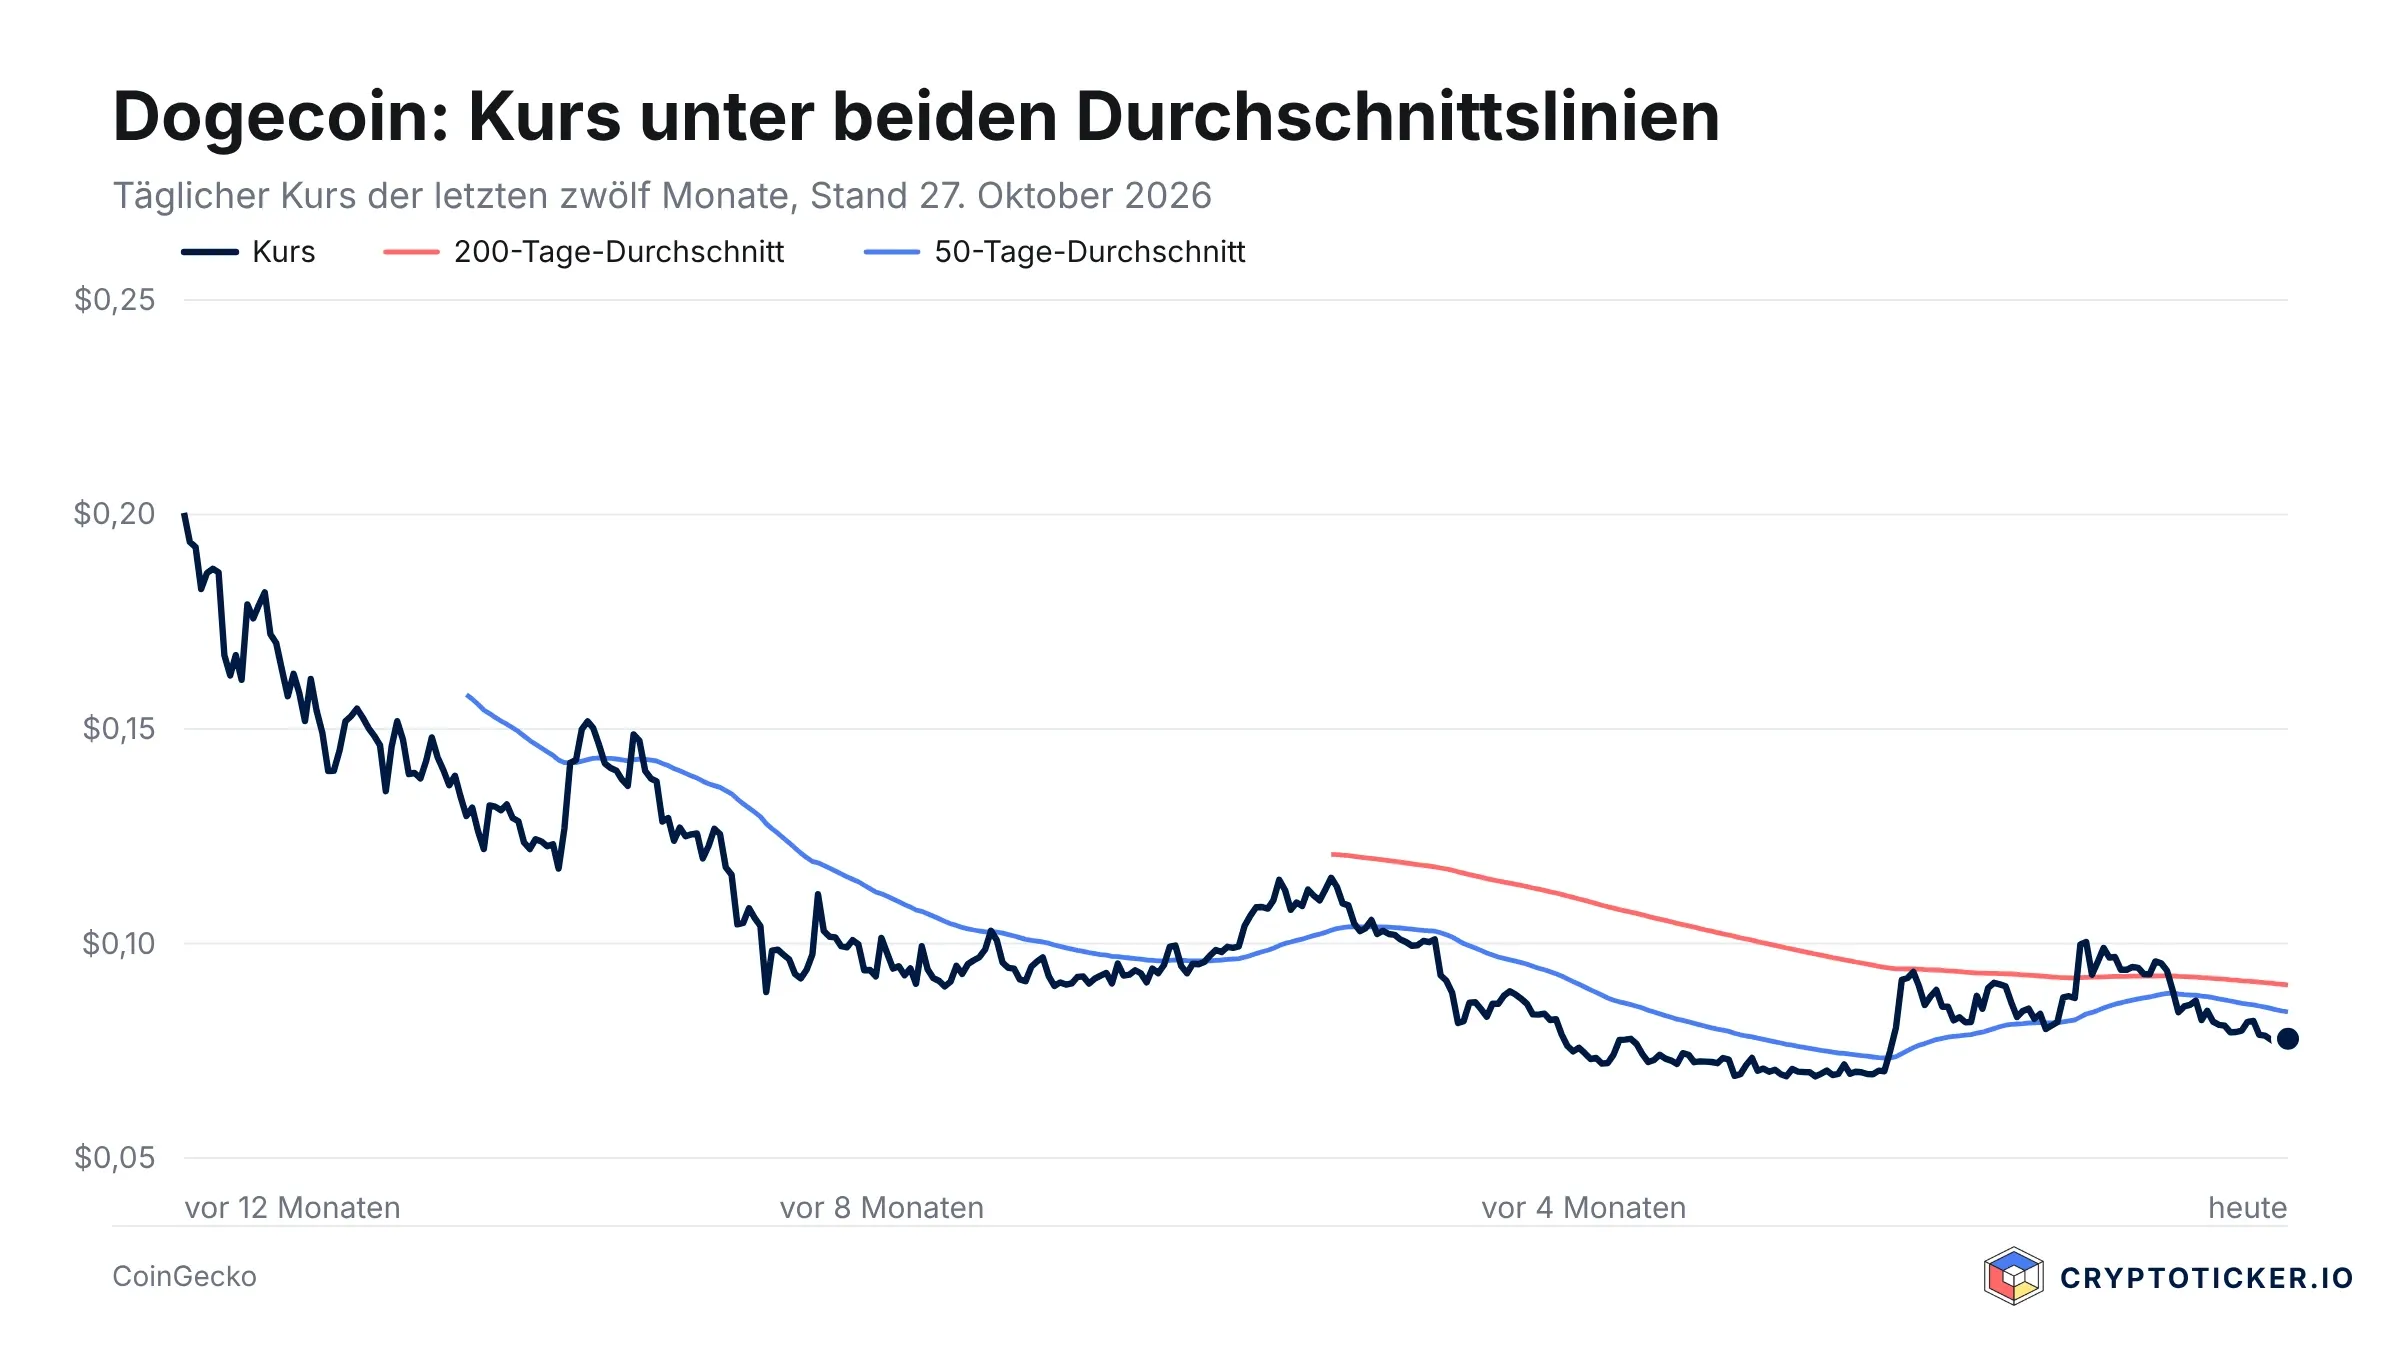
The price (black) has sat below the 50-day average (blue) and the 200-day average (red) for months. Source: CoinGecko, as of October 27, 2026.
The $0.0750 level has held since October 24
On October 24 we asked in this place whether the $0.0750 level would hold. After three days the answer reads: the price has not fallen below it. The lowest level since then came on October 24 at around 16:00 UTC at $0.0756, which is 0.8 percent above the level. Since then the price has moved between $0.0756 and $0.0781, a range of 3.3 percent over three days.
For the level itself that means: not broken, but not confirmed either. A bounce with turnover looks different from a sideways band of three percent. Daily turnover of $373 million equals 3.1 percent of market value, and that too is in line with recent days. Without a multiple of that turnover, the floor at $0.0750 remains a number on the chart and not a documented block of buyers.
October costs Dogecoin 17.1 percent
On September 30 Dogecoin stood at $0.0939. By Tuesday afternoon that had become $0.0778, a monthly loss of 17.1 percent. Bitcoin lost 4.1 percent over the same period, from $83,640 to $80,179. In October, Dogecoin has therefore given up a good four times as much as the market leader.
The month ends on Friday, October 31. Until then the price would have to rise by 20.6 percent to close October without a loss. Its all-time high of $0.7316 is 89.4 percent away.
What an average over ten months actually measures
The 200-day average is not a forecast but a piece of bookkeeping. It averages the prices of the past ten months or so. If it stands at $0.0903, then someone who bought on any given day of that period paid $0.0903 on average. Today's price of $0.0778 lies 13.9 percent below that, which puts the line 16.1 percent above the price.
The 50-day average does the same over a good seven weeks. That it sits at $0.0840, below the longer line, means in arithmetic terms that the past seven weeks were weaker than the past ten months. Both lines are falling. As long as the price stays below both, every attempt at a recovery runs into holders who can sell without a loss only once they are back above their own entry level.
Dogecoin trails the large assets over 30 days
A second point of reference beside the chart is the comparison with the other large assets. Over 30 days, measured on the same Tuesday afternoon, Dogecoin lost 21.2 percent, Litecoin 21.4 percent, Solana 19.0 percent, Shiba Inu 19.0 percent, XRP 14.6 percent, Ethereum 14.3 percent and Bitcoin 5.7 percent. That puts Dogecoin at the lower end of the large assets, together with Litecoin.
This ranking is no accident but a property of the asset: when the overall market falls, the smaller names that are carried more by sentiment give up more than Bitcoin does. For placing today's distance to the yearly line, that means part of it is market conditions and not Dogecoin alone.
Euro pairs carry 0.13 percent of trading
This is where it becomes practical for investors in Germany. On October 23 we counted which pairs Dogecoin is traded through: 96 percent of turnover ran through Tether, 0.13 percent through euro pairs. Anyone who wants to trade at the levels named here in the euro book meets a thin other side there.
In concrete terms that means two things. First, it pays to look into the order book of your own exchange before an order is placed: a market order in a thin book is filled at the price of the next available offer, not at the quoted price. A limit order with your own price costs waiting time but no premium. Second, fees differ markedly between venues, and with an asset that loses 17 percent in a month, an extra half a percent weighs all the more. Which venues list Dogecoin in euros and what they charge is set out in the overview of crypto exchanges.
Two markers well above the ground: $0.0840 and $0.0903 sit 8.0 and 16.1 percent above the price of October 27, 2026.
The range between $0.0766 and $0.0903
To the downside the daily low of $0.0766 counts first, then the $0.0756 of October 24, which is 2.8 percent below the current price, and only then the round level at $0.0750. To the upside the first arithmetic hurdle is the 50-day average at $0.0840, 8.0 percent above the current price. Above that follows the 200-day average at $0.0903, 16.1 percent above the price.
The reason for this order lies not in chart doctrine but in the measurement: each of the four values is either a point at which the price actually turned in recent days, or an arithmetic mean from the price series. Levels that satisfy neither of those two conditions are deliberately absent here, even if round numbers such as $0.10 come up often in comments.
Anyone who holds Dogecoin through an exchange and looks for EU authorisation will find the licensed providers in the list of MiCA-regulated crypto exchanges. A total loss remains possible with any crypto asset.
Our assessment: the gap is wide, but not out of the ordinary
From the editorial team's point of view, the decline carries the marks of a long, orderly downtrend and not those of a slump. Three pieces of evidence speak for that: over the past 24 hours the price moved 0.5 percent higher rather than double digits lower; the daily range from $0.0766 to $0.0781 amounts to 1.9 percent; and the distance to the 200-day average was wider than today on 94 of the 166 preceding days analysed.
Against it speaks the fact that none of these figures shows a turn. The 50-day average lies below the 200-day average on every day of our measurement window, both lines are falling, and October stands 17.1 percent down. As long as the price does not take the $0.0840 from below, every upward move remains a move inside the band that has applied since October 24. An assessment of the situation is not a recommendation to buy or sell.
Dogecoin at $0.0778: without $0.0840 the gap stays
October 27 brings Dogecoin no new direction but a measurable distance: 8.0 percent to the 50-day average, 16.1 percent to the 200-day average, 2.8 percent to the low of October 24. Which of those three numbers goes to zero first will be decided by the turnover of the coming days, and not by the level itself.
(As of October 27, 2026. This article is not investment advice. Prices and fee structures change; check the terms with the provider before you buy.)