This Dogecoin price prediction looks at where DOGE is currently trading near $0.07234. Dogecoin started out in 2013 as a joke coin based on the Shiba Inu meme. But it has since grown into one
This Dogecoin price prediction looks at where DOGE is currently trading near $0.07234. Dogecoin started out in 2013 as a joke coin based on the Shiba Inu meme.
But it has since grown into one of the largest and most actively traded meme coins in the market, with big swings driven mostly by sentiment, community activity, and broader crypto market moves rather than any underlying product.
That same sentiment-driven nature is on display right now, with $DOGE sitting at a point where the next move could go either way.
The rest of this article breaks down exactly what needs to happen for each scenario, plus what the volume and liquidation data say about which side is more exposed right now.
This is not a signal to buy or sell, just a clear map of the levels that matter.
What the Dogecoin Liquidation Data Shows
As per CoinGlass liquidation data for Dogecoin, it shows a lopsided picture:
Over the last 24 hours, long positions accounted for roughly 84% of total liquidations. That skew matters for two reasons. 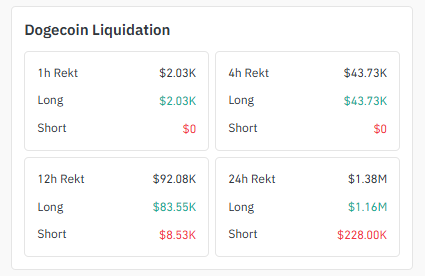
TimeframeTotal LiquidatedLongsShorts1h
$2.03K$2.03K$04h
$43.73K$43.73K$012h
$92.08K$83.55K$8.53K24h
$1.38M$1.16M$228.00K
First, it means recent bounces inside the 4H range have repeatedly trapped leveraged buyers rather than leveraged sellers, which is consistent with a market that has not yet found a bottom.
Second, a market this long-heavy on liquidations can still produce a sharp short-covering rally if shorts get squeezed, so the data leans cautious on longs without ruling out a fast upside wick.
This is a near-term positioning signal, not a directional guarantee, and it can flip within hours as new leverage enters the market.
Volume Distribution: Where the Liquidity Sits
According to Coinglass exchange volume data, Dogecoin futures volume is concentrated on two venues: Binance ($197.83M) and OKX ($133.03M), together accounting for the large majority of tracked futures turnover. 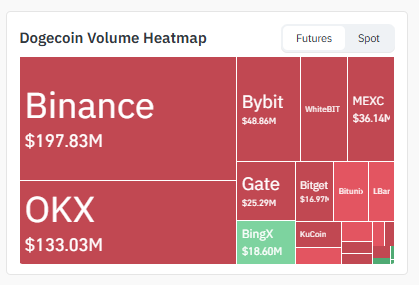
Bybit ($48.86M), Gate ($25.29M), MEXC ($36.14M), and BingX ($18.60M) make up most of the remainder, with WhiteBIT, Bitget, Bitunix, and smaller venues trading in thinner size.
The practical takeaway: because Binance and OKX dominate volume, their order books are the most likely place for a genuine breakout or breakdown to originate, and so are their liquidity zones.
The ones worth watching for confirmation rather than thinner venues where a move can be exaggerated by low depth.
4-Hour Chart: $DOGE Textbook Sideways Consolidation
The 4-hour chart shows DOGE boxed between $0.07093 (support) and $0.07571 (resistance) for roughly the last ten sessions, with price oscillating inside that range without a decisive close on either side.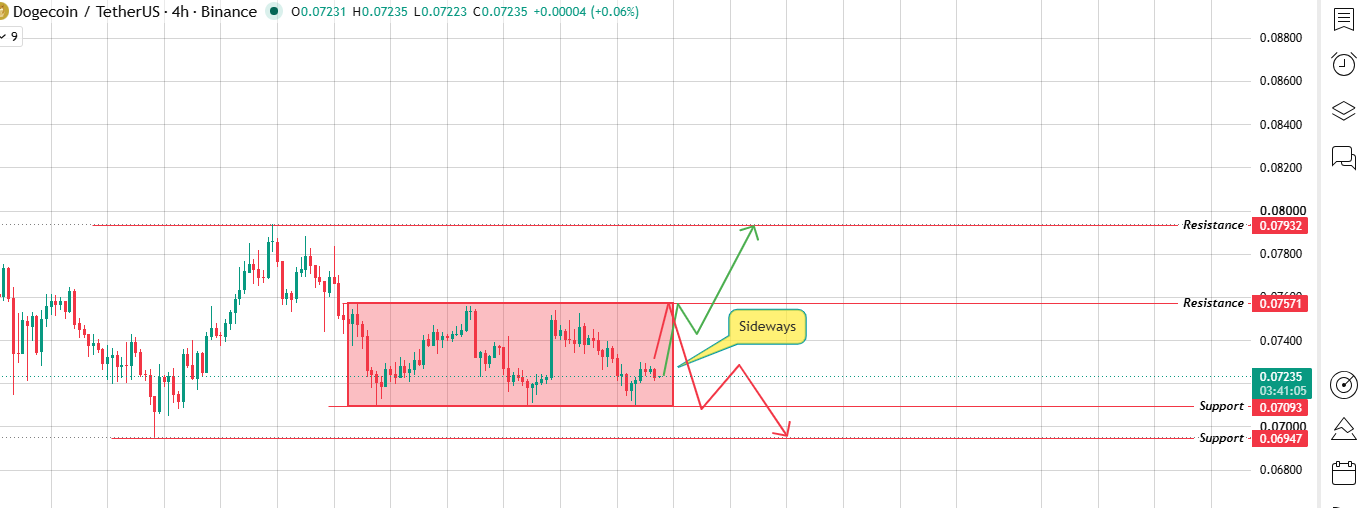 Source:Chart Taken From TradingView
Tight, extended consolidation like this usually precedes a larger move simply because it reflects both sides' building positions rather than one side controlling price.
If $0.07571 breaks with a 4H close above it, the next resistance is $0.07932. A close above that level would be the first real sign that buyers have regained short-term control.
If $0.07093 breaks with a 4H close below it, the price is likely to test $0.06947, just under the $0.07000 psychological level, which has already shown itself to be a weak area.
Until one of these closes happens, the 4H trend is neutral by definition, and treating either edge of the range as a signal before a confirmed close is how most range-bound losses happen.
Daily Chart: Dogecoin Still Under a Descending Trendline
On the daily timeframe, DOGE keeps making lower highs since the $0.09244 peak. Every rally gets rejected by the same descending trendline.
That trendline currently intersects just above the $0.07234 spot price, which is why the coin is coiling right underneath it.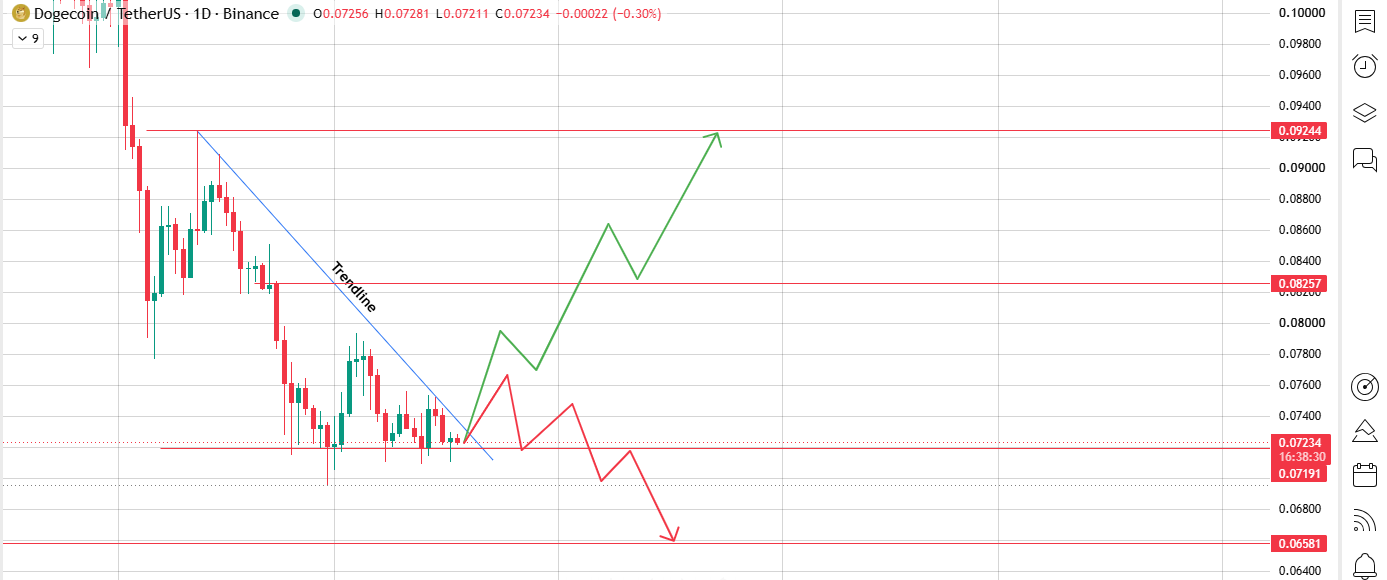
Source: Chart Taken From TradingView
The bull-case trendline breaks with a daily close above it: A confirmed daily close above the trendline opens the path to $0.08257 first, which lines up with a prior consolidation shelf and is likely to see some resistance.
A clean break of $0.08257 on continued volume would put the $0.09244 swing high back in play.
Historically, $DOGE recovery legs from similar descending-channel setups have moved in a stepped pattern: a push, a shallow pullback, then a second push rather than a straight line, so a pullback after the first move should not automatically be read as a failed breakout.
Bear case: the trendline holds, or a breakout fails: if the price cannot close above the trendline or breaks it briefly and fails, the next support is $0.07191, which is close to the current price and offers little cushion.
Below that, $0.06581 is the more significant support; it has acted as a demand zone in prior sessions.
A daily close below $0.06581 would invalidate the near-term bullish case and open room toward lower levels not yet tested on this leg.
Key Levels at a GlanceLevel TypePrice Range4H Resistance
$0.07571 → $0.079324H Support
$0.07093 → $0.06947Daily Breakout Target
$0.08257 → $0.09244Daily Breakdown Target
$0.07191 → $0.06581Dogecoin vs. Other Large-Cap Meme Coins
Compared to other major meme coins, DOGE's current setup, a multi-week descending channel meeting a tight 4H range, is a fairly standard late-downtrend consolidation pattern, rather than anything unique to DOGE specifically.
What differentiates this instance is the liquidation skew: an 84% long-liquidation share over 24 hours is on the higher end for a coin that is not making new lows, which suggests leveraged buyers have been repeatedly early rather than the broader market being aggressively short.
Traders comparing DOGE setups to other meme coins should weigh this positioning data alongside the chart structure, not the chart alone.
Dogecoin Rally Watch: Will Dogecoin Go Back Up, and When Will Dogecoin Reach $1?
Two questions come up constantly around DOGE, so it's worth answering both directly.
Will Dogecoin go back up? In the short term, that depends entirely on the levels already covered above.
A close above $0.07571 and then $0.08257 is what a genuine dogecoin bullish breakout would look like on this chart.
Whether that turns into a sustained dogecoin rally rather than a short bounce depends on whether volume follows through on Binance and OKX and whether the long-liquidation pressure eases.
When will Dogecoin reach $1? At a current circulating supply of roughly 150 billion DOGE, a $1 price would put Dogecoin's market cap north of $150 billion, larger than most large-cap tech stocks and well above DOGE's current market cap, which sits in the low billions.
That's not impossible over a long enough timeframe, but it would require a scale of new demand, adoption, or supply-side change that isn't visible in the current chart, volume, or ETF-flow data.
Nothing in this article's short-term setup speaks to that outcome one way or another, and any specific timeline for $1 should be treated as speculation rather than a forecast.
Bear-Case Risks Beyond the Chart
Two risks sit outside the pure technical picture and could override the levels above:
BTC dominance:if Bitcoin dominance continues rising, capital typically rotates out of lower-cap alts like DOGE first, which can pressure the $0.07093 support independent of DOGE-specific news.
Leverage reset: the current long-liquidation skew means a further leg down could clear out weak-handed longs quickly, producing a sharper wick than the chart structure alone would suggest, followed by a possible snapback.
Neither of these is a base-case assumption here; they are the conditions that would most likely invalidate the bullish read above the trendline.
Methodology: How These Levels Were Built
The levels below come from three independent chart reads, not a single indicator:
Daily (1D) trendline structure: a descending trendline connecting the $0.09244 high to the most recent lower highs, plotted on the Binance DOGE/USDT chart.
4-hour (4H) range mapping horizontal support and resistance drawn from the last 10 sessions of consolidation, also on Binance DOGE/USDT.
Derivatives positioning 1h, 4h, 12h, and 24h long/short liquidation totals, sourced from CoinGlass, is used to gauge which side of the trade is currently more fragile.
A level only counts as "broken" in this analysis on a confirmed candle close beyond it on the relevant timeframe, not an intra-candle wick. A single wick through $0.07093 or $0.07571, for example, does not by itself confirm a breakdown or breakout.
Disclaimer: This article is for informational and educational purposes only and does not constitute financial advice. Cryptocurrency markets are highly volatile. Do your own research and consult a licensed financial advisor before making any trading or investment decision.