Dogecoin is still in the red zone, trading below $0.075 and will require a buy to rally significantly again. The daily chart shows three consecutive declines, signaling a potential bull marke
- Dogecoin is still in the red zone, trading below $0.075 and will require a buy to rally significantly again.
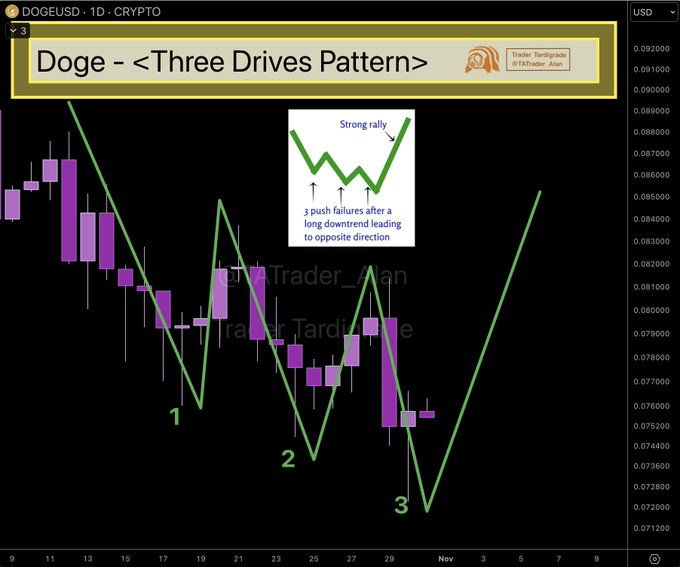
- The daily chart shows three consecutive declines, signaling a potential bull market reversal and the next $0.085 target.
- Traders are tracking resistance at $0.07682 and $0.08147, while $0.07231 and $0.0695 remain important downside levels.
Dogecoin faces another test near $0.075 as traders weigh recent losses against a possible reversal pattern on its daily chart.
Three Downward Swings Shape the Bullish Setup
Trader Tardigrade recently posted a daily chart showing three successive declines in Dogecoin. The trader described the formation as a possible Three Drives Pattern, which can appear near the end of a downtrend. Its appearance alone, however, does not confirm that prices have reached a bottom.
Source:
X
The first drop was around October 17 when it dropped to around $0.076. But now, buyers raised the price up to $0.085, and sellers came back. That recovery separated the first downward move from the next decline.
The second drop developed around October 25, taking DOGE towards $0.0735. The price then climbed towards $0.082, but the advance failed to hold. Sellers regained control and pushed the market lower again.
The third decline appeared around October 31, with the chart marking a low near $0.0715. The green projection points towards a possible recovery to approximately $0.085. That move would require buyers to overcome several price barriers along the way.
The supplied 24-hour exchange chart shows a wide gap between the largest platforms. In the left panel, OKX records $42.10 million, ahead of Binance at $27.89 million. Gate follows with $23.78 million, while Bitget records $9.70 million.
Coinbase registered $7.91 million, followed by Upbit at $7.06 million. Bybit records $5.36 million, while Bitstamp reaches $3.22 million. The figures show that activity in this panel is concentrated among three leading exchanges.

The right panel has a different order, with Binance leading at $1.76 million. Upbit follows at $1.58 million, while Gate records $1.44 million. Bybit contributes $1.18 million, placing it fourth in that panel.
Bitstamp records $772,360, while Bitget reaches $626,640. OKX shows $416,170, with Coinbase at approximately $277,340. The chart has no metric or colour legend indicating, which makes it impossible to determine if it is a buying or selling activity.
Dogecoin Price Levels Define the Next Test
The supplied market data as of writing places Dogecoin at $0.07484, down 0.56% over 24 hours. Its seven-day decline stands at 3.51%, while reported daily volume reaches $507.64 million. The current quote also leaves the token below the closely watched $0.075 level.
An earlier update recorded a rebound to $0.07585 from the October 29 low of $0.07231. That represented a 4.90% increase from the session's reported low. The latest price has since slipped beneath the $0.075 threshold.
A move above $0.075 would bring the $0.07682 level into focus. Beyond that, the reported seven-day high sits at $0.08147. A break above both prices would put the projected $0.085 target closer.
The October 31 market update also cited $1.68 billion in crypto liquidations over 24 hours. Long positions accounted for $1.43 billion of that total. Forced closures of leveraged positions added to the selling pressure during the market-wide decline.
On the downside, $0.07231 remains the first major reference point, followed by $0.0695. A break beneath the October 29 low would weaken the three-swing bullish setup. For now, traders are watching whether buyers can reclaim $0.075 and hold it.