Dogecoin's position below a rising channel has revived comparisons with previous cycles, although another substantial rebound remains unconfirmed. Negative exchange netflows do not confirm bu
- Dogecoin's position below a rising channel has revived comparisons with previous cycles, although another substantial rebound remains unconfirmed.
- Negative exchange netflows do not confirm bullish sentiment or accumulation, and can decrease immediate net supply for selling.
- DOGE's recent weekly drop continues to indicate weakness, prompting traders to await price confirmation and channel support before making a reversal move.
Dogecoin's price outlook is still unclear, as the cryptocurrency continues to trade below its rising long-term trendline and market expectations are influenced by declining momentum and trading volume on exchanges.
Long-Term Channel Pattern Draws Attention
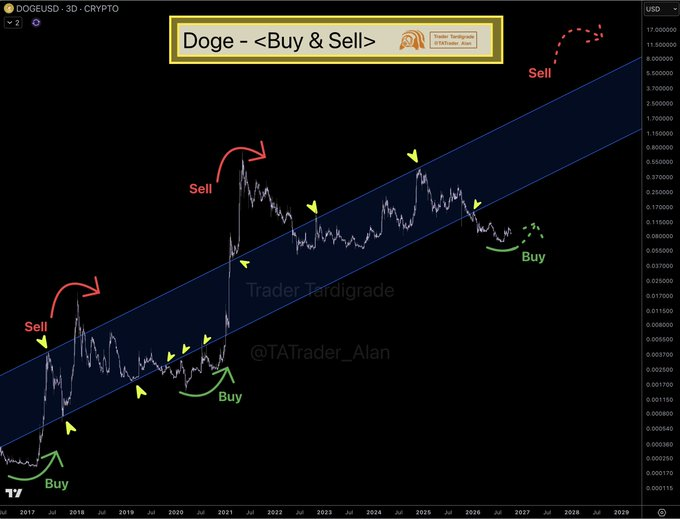
Crypto analyst Trader Tardigrade has identified a recurring pattern involving Dogecoin's rising parallel channel. In a post on X, the analyst described buying below the channel and selling above it. The strategy also favors holding while prices remain inside the channel.
Source:
X
The accompanying three-day chart traces this structure across several market cycles.The bottom boundary represents possible support, and the top boundary represents possible resistance. These are the levels that DOGE has consistently broken before turning around and reversing its course.
According to the chart, previous moves below the channel preceded substantial recoveries. These examples form the basis of the current bullish scenario. However, historical rebounds do not guarantee another rally under present market conditions.
The chart also marks out previous overshoots above the upper boundary as a possible sale point. Extensions can be a sign that prices have broken out of their normal trading range. Traders should wait for confirmation before taking these deviations as sure signals of a reversal.
DOGE Price Weakness and Exchange Flows
DOGE as of the time of writing traded at $0.08376 in the supplied market data, recording a 2.70% daily decline.It lost 12.14% over its seven-day run. The 24-hour trading volume was about $791.74 million.
The exchange-flow chart shows frequent negative netflow readings throughout the observed period. Red bars represent negative readings, while green bars indicate positive netflows. Several pronounced spikes appear during January, February, and late September.

Exchange activity is distributed across platforms, including OKX, Binance, Gate, and Upbit. The left-hand panel lists approximately $1.40 million for OKX and $1.39 million for Binance. Gate records $684,330, while Upbit shows $496,870 in the same panel.
The right-hand panel displays smaller figures for these exchanges. OKX records $197,680, Gate $159,140, Upbit $143,480, and Binance $104,590. The image does not clearly specify the panels' measurement periods or full color definitions.
Support, Momentum and Potential Reversal
Negative exchange netflows indicate that more tokens leave exchanges than enter them. movements may limit the amount on hand that can be sold by exchange. But withdrawals do not constitute a bull market bottom or a bull reversal.
On the other hand, the price line below displays DOGE falling from higher levels during the months of December and January. The cryptocurrency lost value during much of the first half of the period. There was a recovery attempt in late August/September but further weakness followed.
The long-term channel serves as a guideline for observing possible turning points. If the recovery exceeds its bottom, it may lend more support to returning to the building. However, if trading breaks below support again, the hoped-for bounce will be disregarded.
The current configuration also has to be focused on the overall market and trading volume. Any further price recovery and stronger demand would follow. Otherwise the historical channel pattern is a reference and not a reliable prediction.
For the time being, Dogecoin looks to be in a downward trend and has a technical setup that is questionable. Trader Tardigrade's approach identifies the current deviation as a potential buying zone. Whether that signal produces another recovery depends on subsequent price action, not historical resemblance alone.