edgeX price prediction chatter is spiking today after EDGE ripped higher out of nowhere. Traders who wrote this coin off last week are now scrambling back in. What actually changed, and does
edgeX price prediction chatter is spiking today after EDGE ripped higher out of nowhere. Traders who wrote this coin off last week are now scrambling back in. What actually changed, and does this move have real legs, or is it another fast pump that fades just as quickly? Stick around, because the chart is telling a very specific story right now.
Why Is edgeX Suddenly the Coin Everyone Is Talking About
edgeX price prediction searches jumped the moment EDGE broke out of a pattern it had been stuck in for weeks. Basically, the coin went from being ignored to being everywhere on trading feeds within a single session.
Here's the thing: sharp moves like this rarely happen without a reason. Something shifted in demand, and buyers showed up fast.
We pulled up the order flow, and the first thing that stood out was how thin the sell side looked. That gap let the price run.
Is this the start of something bigger or a short squeeze that burns out just as fast?
edgeX Price Snapshot: What the Numbers Show Right Now
MetricDetailCoin NameedgeXTicker SymbolEDGEBlockchainEthereum (ERC-20)Today High$0.4627Today Low$0.3146RSI Level92.86Token TypeUtility and GovernanceToken CategoryPerpetuals DEX, DeFiMarket Cap$170.84M24H Trading Volume$64.15M24H Trading Volume Change+101.4%Circulating Supply350M EDGE24H Change+53.3%
Source: Data by CoinMarketCap
What Exactly Is edgeX and Why It Even Exists
edgeX runs as an ERC-20 token, tied closely to the sameEthereum price outlook that shapes most tokens built on that chain. It launched to give traders a faster onchain alternative to slower exchanges, and that positioning is exactly why volume keeps showing up during volatile sessions.
Why edgeX Is Grabbing Attention Beyond the Chart
And this is not pure hype. edgeX sits inside the Binance Alpha ecosystem and even shows up among activeBinance Alpha airdrops, which already puts it in front of a large trading audience.
The project also carries real usage tied to perpetuals trading, not just a speculative token sitting idle. Anyone following thelatest crypto news has seen holder counts like this climb past 18,000 fast.
How Much Money Got Wiped Out in $EDGE Liquidations
Fast moves like this always leave a trail. In the last 24 hours, edgeX liquidations hit $1.79M, with short sellers taking the bigger hit at $1.26M against just $539.22K on the long side.
Zoom into the last 4 hours, and shorts got squeezed again, losing $615.31K compared to $158.60K on longs. That imbalance says a lot about who got caught on the wrong foot.
Source: Liquidation data by CoinGlass
Technical Analysis: Breaking Down the edgeX Chart: What Traders Are Seeing
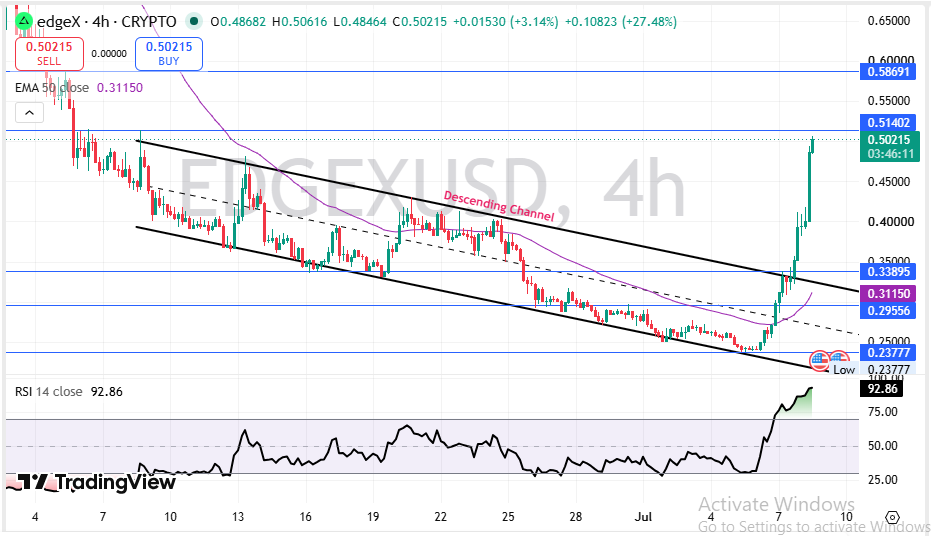
Price broke clean above a descending channel that had trapped EDGE since early June. That kind of breakout, backed by real volume, tends to attract fresh buyers fast.
Source: Charting by TradingView
edgeX is trading near $0.50 on the 4-hour chart, sitting well above the 50 EMA at $0.3115. That gap alone tells you buyers are firmly in control right now.
RSI sits at 92.86. That's deep overbought territory, similar to readings often seen alongside an extreme reading on thefear and greed index during blow-off rallies.
Immediate resistance sits at $0.51402, then $0.58691 above that. Support now rests near $0.33895, a level that used to act as resistance before the breakout flipped it.
The structure is bullish. But overbought readings this extreme rarely go in a straight line.
Where Is edgeX Actually Being Traded the Most
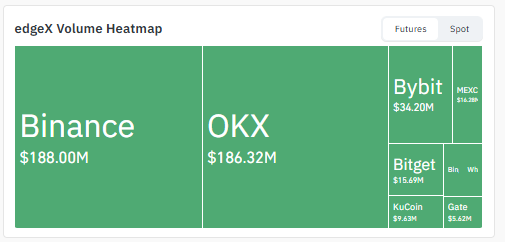
Binance and OKX dominate $EDGE volume amongmajor exchanges right now, with $188.00M and $186.32M in futures activity, respectively. Bybit trails at $34.20M, followed by smaller volume across MEXC, Bitget, KuCoin, and Gate.
That kind of concentration on two exchanges means price can move fast when either one sees a large order hit the book.
Source: Volume heatmap by CoinGlass
edgeX Short- Term Price Prediction: What Comes Next
The next few days likely decide whether this breakout sticks or fades back into the old range.
TimeframeBearish TargetBase TargetBullish TargetKey Trigger24 Hours$0.42$0.48$0.514RSI cooldown vs fresh buying3–7 Days$0.36$0.44$0.587Hold above old resistance turned support2–4 Weeks$0.30$0.40$0.65Sustained volume on Binance and OKX
Watch the $0.339 zone. Losing it would undo most of this week's gain.
edgeX Long-Term Price Prediction: The Bigger Picture
Zooming out, edgeX still needs consistent volume and real platform usage.
TimeframeBearish TargetBase TargetBullish TargetCatalyst Needed3 Months$0.25$0.45$0.75Sustained perpetuals trading growth6 Months$0.20$0.55$0.95New exchange listings and integrationsEnd of Year$0.18$0.65$1.20Broader altcoin market recovery2027 Outlook$0.15$0.80$1.54Platform adoption matching early hype
Honestly, the long-term case is not proven yet. It's promising, but it still needs follow-through.
Three Ways the $EDGE Price Story Could Play Out
Worst Case: RSI cools sharply and shorts reload, dragging price back under $0.339 support.
Base Case: Price consolidates between $0.40 and $0.51 as the market digests this move.
Best Case: Volume holds up, resistance at $0.514 breaks, and price pushes toward $0.587 fast.
ScenarioPrice RangeWhat Triggers ItWorst Case$0.25 to $0.33Support breakdown, long squeezeBase Case$0.40 to $0.51Sideways digestion after the spikeBest Case$0.514 to $0.65Breakout continuation on strong volumeedgeX Key Price Levels Every Trader Should Watch
Resistance zone: $0.514 first, then $0.587 above. A close above both on volume opens real upside room.
Support zone: $0.339, the old resistance that flipped after the breakout. Holding this keeps the bullish structure intact.
Invalidation zone: below $0.29556. A close under this level would undo the entire breakout thesis.
edgeX Analyst View: Final Thoughts on This Rally
When we look at this setup, the RSI at 92.86 is the number that stands out most. Moves this extended rarely continue without pausing first.
A weekly close above $0.514 would confirm this is more than a squeeze. Anything less and this could just be a sharp reaction move.
One thing worth tracking beyond the chart: the current Bitcoin price outlook sets the tone for how much risk traders are willing to take on altcoins like this one.
The most important level right now is $0.339. Lose it, and this entire breakout story falls apart fast.
Bold moves need bold confirmation. edgeX has not fully earned that yet.
Disclaimer: This article is for educational purposes only and does not constitute financial advice. Crypto markets are volatile. Consult your investment advisor before making any investment decision.