Ethereum faces a critical price threshold at $1,749, where data indicates that a breakout above this level could trigger approximately $677 million in cumulative short order liquidation inten
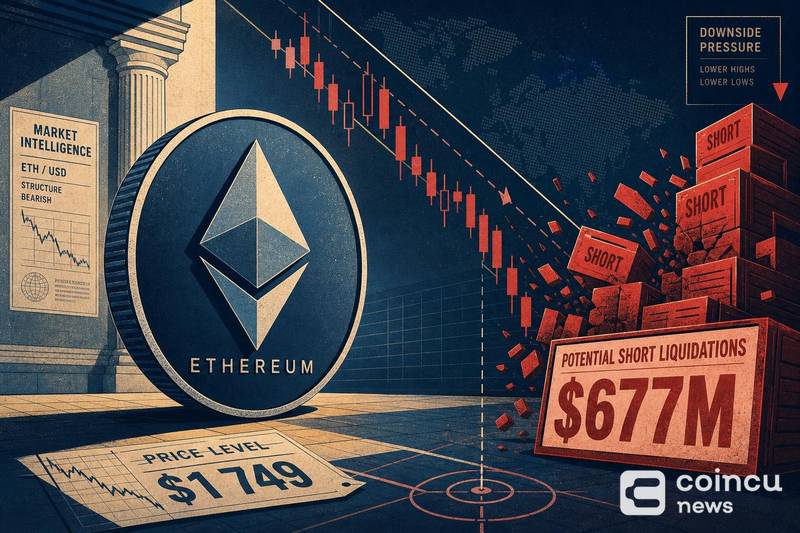
Ethereum faces a critical price threshold at $1,749, where data indicates that a breakout above this level could trigger approximately $677 million in cumulative short order liquidation intensity across mainstream centralized exchanges.
The figure comes from Coinglass liquidation heatmap data, which tracks clusters of leveraged positions on major CEX platforms that would be forcibly closed at specific price levels. The $1,749 mark represents a dense concentration of short positions vulnerable to liquidation if ETH pushes above it.
What the $677 Million Short Liquidation Cluster Means
The $677 million figure refers to cumulative short liquidation intensity, not a single order. It represents the aggregate value of short positions across multiple mainstream centralized exchanges that would face forced closure if ETH breaks through $1,749.
When short positions are liquidated, the exchange automatically buys back the asset to close the trade. This creates additional buy pressure at the exact moment price is already rising, which can accelerate the move higher and trigger further liquidations in a cascading effect.
The concentration of short exposure at this level suggests that a significant number of traders have placed bearish bets near or around $1,749. A report tracking similar ETH liquidation setups on major CEXs reinforces the scale of leveraged short exposure building around this price range.
How CEX Liquidation Pressure Can Amplify Volatility
Centralized exchanges are where the majority of leveraged crypto trading occurs. When a liquidation cluster of this size sits just above the current price, it creates asymmetric risk for short sellers.
If ETH approaches $1,749 and buying momentum builds, the first wave of liquidations can compound into a short squeeze. Forced buy orders from liquidated shorts push the price higher, which triggers additional liquidations at slightly higher levels, creating a feedback loop.
This dynamic is particularly relevant on mainstream CEX platforms, where leverage ratios tend to be higher and liquidation engines operate automatically. The result can be sharp, sudden price spikes that move faster than manual traders can react. Similar patterns of large-scale activity on centralized exchanges have recently highlighted how concentrated trading flows can move markets.
What Traders Should Watch Near the Breakout Zone
The $1,749 level functions as a binary trigger. If ETH approaches but fails to break through, the short positions remain intact and sellers retain control. A decisive move above it, however, could unlock the full $677 million liquidation cascade.
Key signals to monitor include trading volume as ETH nears the threshold, the rate of open interest changes on futures markets, and whether spot buying or derivatives activity is leading the move. A breakout driven by spot demand tends to be more sustainable than one fueled purely by leverage.
Traders watching this setup should also consider that liquidation heatmaps show a snapshot in time. Positions can be closed or adjusted before the trigger level is reached, which means the actual liquidation volume at the moment of breakout may differ from the current estimate. Activity across major exchange platforms can shift rapidly as new listings and trading pairs redirect capital flows.
The broader derivatives landscape, including how assets like BNB and other tokens are positioned, can also provide context for overall market leverage sentiment.
FAQ About ETH's $1,749 Liquidation Setup
What happens if ETH breaks above $1,749?
If ETH breaks above $1,749, up to $677 million in cumulative short positions on mainstream centralized exchanges could face forced liquidation. These forced closures generate automatic buy orders, which can accelerate upward price momentum.
What does short liquidation intensity mean?
Short liquidation intensity measures the cumulative value of short (bearish) leveraged positions that would be forcibly closed at a given price level. A higher intensity figure means more capital is at risk of liquidation, increasing the potential for a sharp price move.
Which exchanges are affected?
The data covers mainstream centralized exchanges (CEXs) collectively. The liquidation heatmap aggregates data across multiple major platforms rather than isolating a single venue.
No. The figure represents current positioning and can change as traders adjust or close their positions before the price reaches $1,749. Liquidation heatmaps reflect a real-time snapshot, not a fixed outcome.
Disclaimer: This article is for informational purposes only and does not constitute financial or investment advice. Cryptocurrency and digital asset markets carry significant risk. Always do your own research before making decisions.
The post ETH at $1,749 Could Trigger $677M in Short Liquidations was initially published on Coincu.