Key Highlights ETH is trading at $2,229.55 — down 5.65% in 24h — inside the $2,000–$2,300 buy zone flagged by analyst CryptoBullet1 Loss of the 200-Week Moving Average on the weekly chart con
Key Highlights
ETH is trading at $2,229.55 — down 5.65% in 24h — inside the $2,000–$2,300 buy zone flagged by analyst CryptoBullet1
Loss of the 200-Week Moving Average on the weekly chart confirmed mid-term correction; Fibonacci 0.382–0.618 band maps to the $2,000–$2,300 accumulation zone
Spot ETH ETFs logged $105.5M in net outflows on Oct 29 — fourth consecutive outflow day
Watch $2,000 — a weekly close below invalidates the entire dip-buying zone identified on the 1-week chart
Ethereum is trading at $2,229.55 — down 5.65% in the past 24 hours — and has now entered a pre-identified accumulation zone that one crypto analyst flagged eleven days ago as the critical dip-buying window for this cycle.
The setup belongs to an analyst who goes by the handle CryptoBullet1 on X. On October 19, 2026, the analyst published a 1-week ETH/USDT chart flagging a loss of the 200-Week Moving Average as confirmation of a mid-term correction — and simultaneously identified $2,000–$2,300 as the “Buy The Dip” zone to watch. On October 30, with ETH trading inside that exact range, the analyst posted a single-line confirmation: “$ETH has entered my ‘Buy The Dip’ Zone”
The 200-Week Moving Average is one of the most widely tracked long-term trend filters in crypto markets. A sustained weekly close below it is not a routine pullback event — it has historically coincided with mid-cycle corrections of significant depth. The analyst’s October 19 note treated the break explicitly as “mid-term correction confirmed,” not as a bear market call. The distinction matters: the same note immediately identified a recovery zone, which is a structurally different posture from a breakdown thesis.
The weekly chart shared by the analyst shows an Elliott Wave corrective structure. The impulse sequence — waves (1) through (5) — completed at a prior cycle high, and the current price action represents the correction phase. The analyst has drawn a green “buy zone” rectangle covering the Fibonacci 0.382–0.618 retracement band, which on the weekly chart corresponds to the $2,000–$2,300 range. With ETH at $2,229.55 at time of writing, price is sitting inside that green zone.
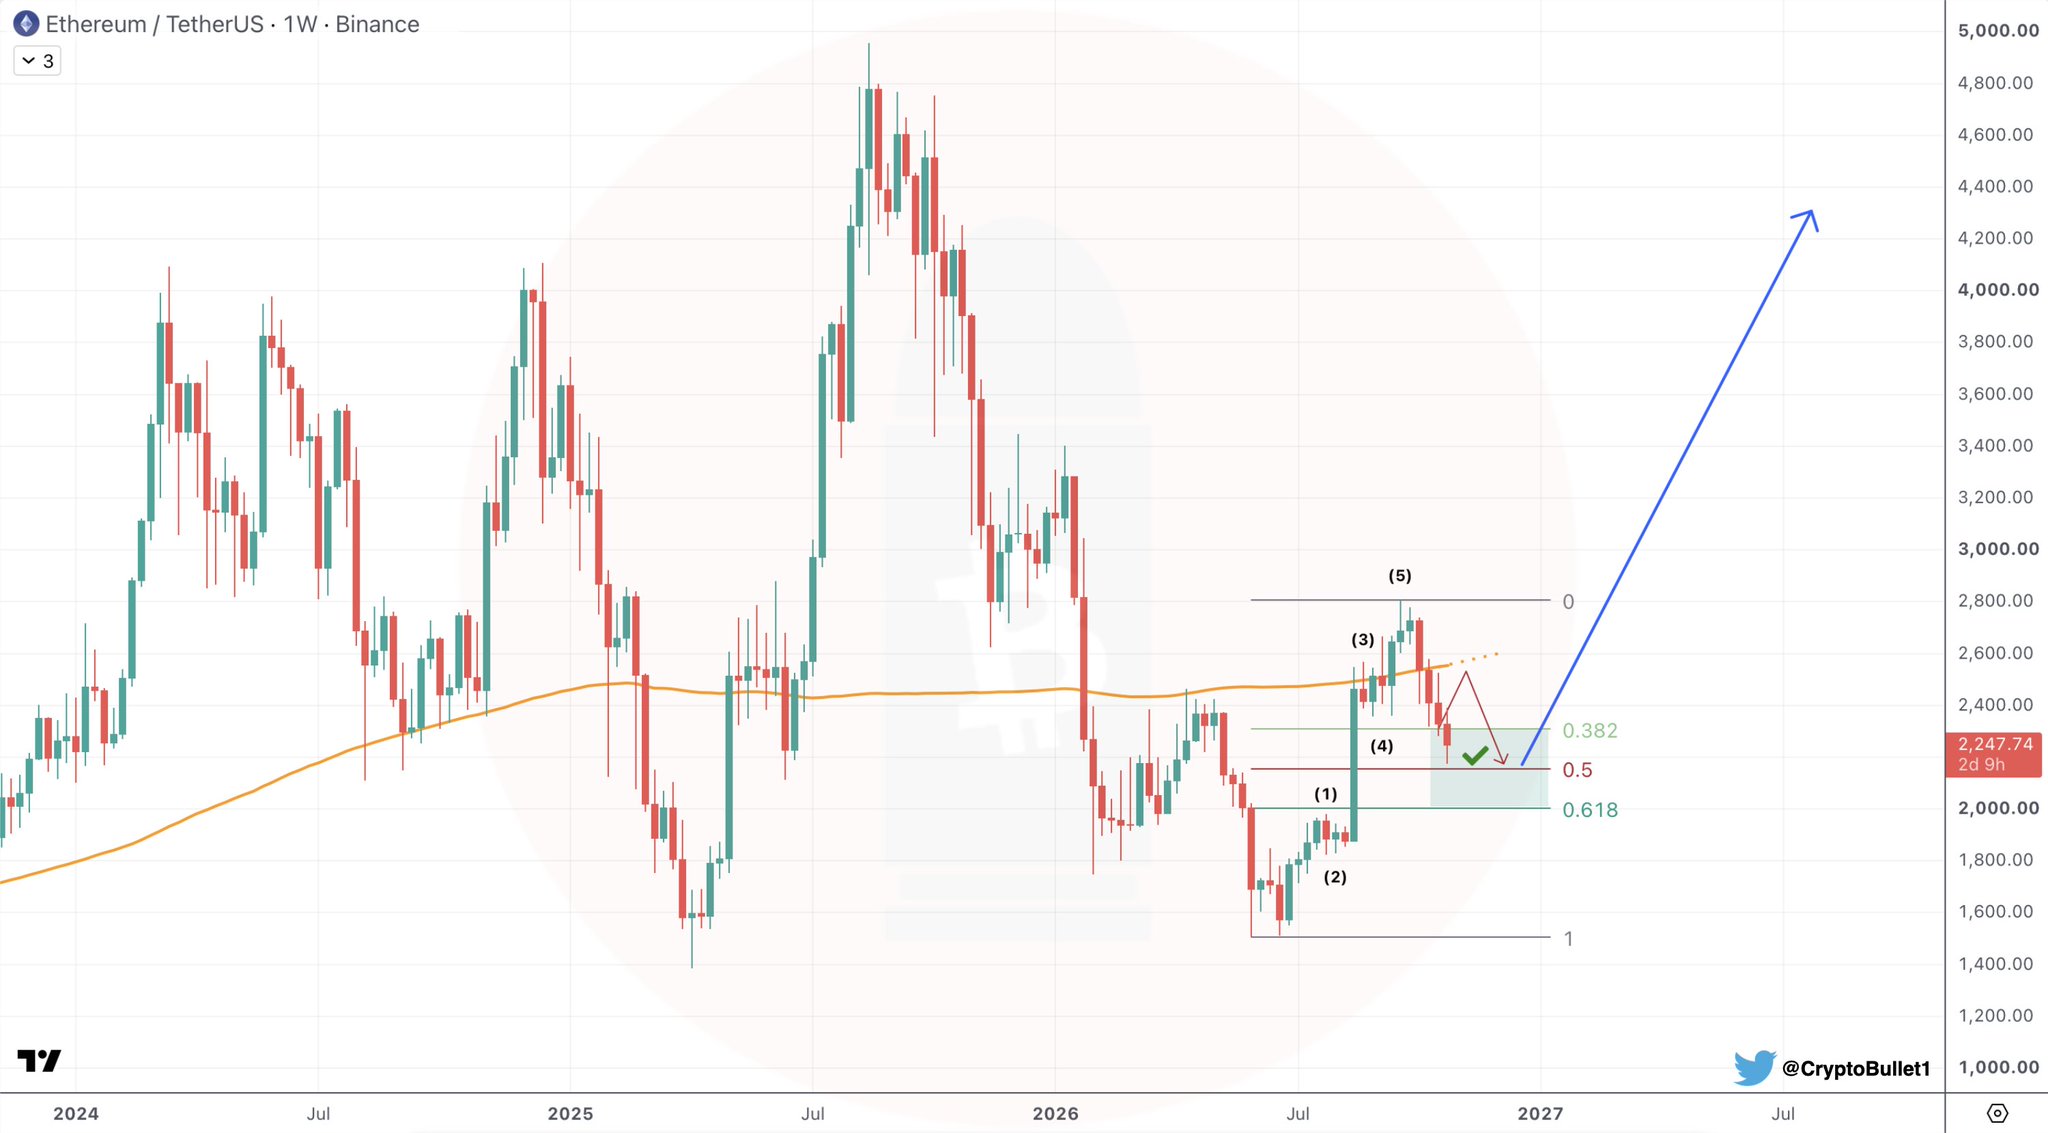
ETH/USDT Weekly | Source: @CryptoBullet1 (X)
The macro context around this dip is not favorable in the short run. Spot Ethereum ETF data via SoSoValue shows a daily net outflow of $105.5M on October 29, extending a streak of four consecutive outflow days. The five-day net outflow totals $271.3M. ETHA led the redemptions at $71.7M, while FETH was the sole fund registering inflows at $2.9M. Total ETF net assets stand at $13.98B against cumulative net inflows of $12.44B since launch — meaning the product category is still net positive but losing institutional ground in the near term.
These outflows are consistent with the price behavior the analyst anticipated. A 200-Week MA break accompanied by ETF redemptions creates the exact kind of forced selling that compresses price into accumulation zones — which is precisely what this setup requires to function. For context on how ETH has been trading relative to broader crypto rebound targets, see BTC, ETH, XRP Rebound Targets: $86,500, $2,700, and $1.55 in Focus.
DeFiLlama data shows Ethereum’s network fundamentals remain intact despite the price drawdown. Total Value Locked on Ethereum stands at $42.89B. The network generated $58.07M in fees over the past 24 hours and $114.14M over the past seven days. DEX volume over the last 24 hours reached $6.24B, with a seven-day total of $13.12B. These are not the metrics of a chain losing adoption — they are the metrics of a chain whose token is temporarily repriced below its activity levels.
The macro backdrop adds another layer of caution. FOMC rate outlook data via SoSoValue shows markets pricing a 76.1% probability of a 25 bp hike to the 4.00%–4.25% target rate at the December 9 FOMC meeting. With CPI data due November 10 and PMI prints arriving November 1–3, the next two weeks carry macro event risk that could extend the sell-off — or provide the catalyst for stabilization inside the $2,000–$2,300 zone.
The analyst’s call is zone-based, not level-based. The stated accumulation window is $2,000–$2,300 — a 300-point wide band on the weekly chart. ETH at $2,229.55 is 1.3% above the midpoint of that zone ($2,150) and 11.4% above the bottom of the zone ($2,000). The analyst has not published a recovery target, a reclaim timeline, or an invalidation level beyond the $2,000 floor implied by the zone’s lower boundary. There are no additional price levels in the source material.
What the signal confirms with certainty: the correction that began when ETH lost the 200-Week MA has compressed price into the pre-identified Fibonacci retracement window. What it does not confirm: the timing or magnitude of any recovery from this zone. The Elliott Wave structure shown on the weekly chart suggests the correction is in a mature phase — but wave counts are probabilistic, not deterministic.
For historical context on large ETH wallet activity that often coincides with zone entries like this, see Mysterious Whale Swaps 229 BTC for 7,469.8 ETH in a $19.1M Rotation.
The analyst’s zone has a floor at $2,000. That is the number. A weekly close below $2,000 would place ETH outside the entire Fibonacci retracement band the analyst identified as the dip-buying window — and would structurally invalidate the setup. As long as ETH holds above $2,000 on a weekly closing basis, the correction thesis remains within the parameters the analyst outlined on October 19.
Ethereum is trading at $2,229.55 inside a pre-mapped accumulation zone. The 200-Week MA break confirmed the correction. The Fibonacci 0.382–0.618 band defined the landing zone. ETF outflows and macro event risk keep near-term pressure elevated. The number every participant in this setup is watching is $2,000 — the floor of the analyst’s zone, and the level that determines whether the dip-buying thesis remains structurally intact.
Disclaimer: The views and analysis presented in this article are for informational purposes only and reflect the author’s perspective, not financial advice. Technical patterns and indicators discussed are subject to market volatility and may or may not yield the anticipated results. Investors are advised to exercise caution, conduct independent research, and make decisions aligned with their individual risk tolerance.