Key Highlights ETH trading at $2,397.96 (+1.16% 24h) after losing the 200-Week MA — confirming a mid-term correction per @CryptoBullet1 Analyst identifies $2,000–$2,300 as the structured dip-
Key Highlights
ETH trading at $2,397.96 (+1.16% 24h) after losing the 200-Week MA — confirming a mid-term correction per @CryptoBullet1
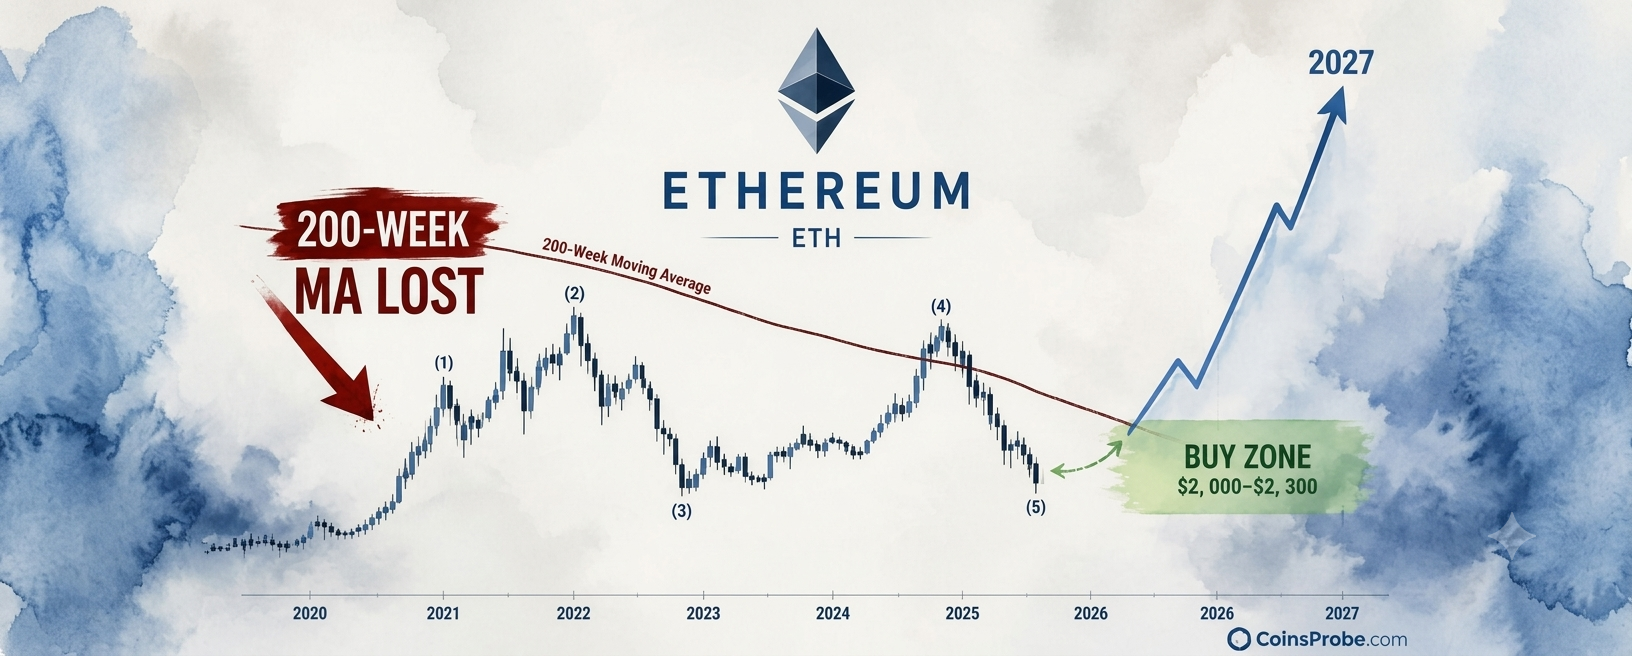
Analyst identifies $2,000–$2,300 as the structured dip-buying zone, aligning with Elliott Wave wave (4) Fibonacci retracement
ETH is ~$98 above the top of the buy zone ($2,300) — zone not yet reached at time of writing
Weekly close back above the 200-Week MA is the first confirmation level for any corrective recovery
Ethereum is trading at approximately $2,397.96 — up 1.16% in the past 24 hours — with a market cap of $292.9 billion. Despite the brief intraday recovery, the weekly chart has delivered a structural verdict: ETH has lost the 200-Week Moving Average, and that loss now confirms a mid-term correction is underway.
That is the assessment of analyst @CryptoBullet1, who posted the call on October 19, 2026 — a weekly chart read that has since drawn 21,000 views. The core message is unambiguous: the 200-Week MA is broken, not retested. And rather than call a bottom, @CryptoBullet1 identifies a specific zone to wait for it — $2,000 to $2,300.
The 200-Week Moving Average is the longest standard moving average tracked on crypto weekly charts. It is not a momentum indicator. It is a long-cycle mean — the average closing price of the last 200 weeks, smoothed across roughly four years of market history. In practical terms, it separates bull-market structure from mid-term correction territory. When ETH trades above it, price is historically above its long-run average. When price falls below it, the structural assumption shifts.
@CryptoBullet1’s call is not that ETH has entered a bear market. The language is precise: “mid-term correction” — a distinction that matters for positioning. Corrections can be bought. Bear markets require a different framework entirely.
The weekly chart shared by @CryptoBullet1 shows ETH breaking and closing below the 200-Week MA, an event that shifts the short-term bias from neutral to corrective. The chart also overlays an Elliott Wave count — five labeled waves with wave (4) completing into a Fibonacci retracement zone between the 0.382 and 0.618 levels. The blue projected arrow on the chart points sharply higher into 2027, representing a wave (5) target that @CryptoBullet1 is positioning toward — but only after the correction resolves.

Chart Analysis | Source: @CryptoBullet1 (X)
The Fibonacci support box on the chart visually aligns with the $2,000–$2,300 zone stated in the tweet text. This is not a single price level — it is a 300-point structured accumulation range that @CryptoBullet1 frames as the buy-the-dip window before any next impulse.
Institutional positioning in ETH has remained active through this correction. SharpLink Gaming recently staked 42,074 ETH worth $112.8M, bringing its total ETH holdings to $2.4 billion — a signal that long-horizon holders are not exiting into this mid-term weakness. Separately, a major whale rotated $19.1M from BTC into ETH — a cross-asset move that suggests at least some sophisticated participants are already treating current levels as early-stage accumulation territory.
@CryptoBullet1 does not name a precise entry price. He names a zone — $2,000 to $2,300. The distinction matters. A zone-based approach acknowledges that corrections rarely print a clean single wick low. The lower bound of $2,000 represents a round-number psychological level. The upper bound of $2,300 aligns with Fibonacci retracement geometry visible on the chart. Together, they define a 13% range from the zone top to the zone bottom — giving staged buyers room to scale.
At the time of writing, ETH at $2,397.96 is approximately $98 above the top of the buy zone. The zone has not yet been reached. @CryptoBullet1’s call is not a current buy recommendation — it is a forward-looking positioning plan contingent on price reaching the stated range.
For context on recent price action, Ethereum had previously formed a bull flag with $2,700 flagged as the breakout trigger — a level that was never sustained. The failure to hold above $2,700 and the subsequent 200-Week MA breach is the structural sequence that brings @CryptoBullet1’s correction thesis into focus.
Bullish Scenario
ETH reaches the $2,000–$2,300 buy zone, finds demand within that Fibonacci band, and begins a wave (5) recovery impulse. The Elliott Wave projection on @CryptoBullet1’s chart targets a significant move toward 2027, though no specific price ceiling for wave (5) is stated in the tweet. A weekly close reclaiming the 200-Week MA would be the first technical confirmation that the correction has resolved.
Bearish Scenario
A weekly close below $2,000 — the lower bound of the buy zone — would invalidate the correction-and-recover thesis and open the possibility of deeper structural damage. At that point, the 200-Week MA would be significantly overhead, and the Elliott Wave count would require reassessment. @CryptoBullet1 does not provide a stop-loss level in the posted analysis.
The 200-Week MA loss is confirmed. The $2,000–$2,300 zone is @CryptoBullet1’s defined dip-buying window. At $2,397.96, ETH is sitting just above the entry range — close enough that the setup is live, but not yet triggered. Whether ETH dips into the zone cleanly, or stabilizes here and forces buyers to chase, is the question the weekly chart will answer in sessions ahead. Watch $2,300 as the line that opens the structured buy window — and $2,000 as the floor that must hold to keep the correction thesis intact.
Disclaimer: The views and analysis presented in this article are for informational purposes only and reflect the author’s perspective, not financial advice. Technical patterns and indicators discussed are subject to market volatility and may or may not yield anticipated results. Investors are advised to exercise caution, conduct independent research, and make decisions aligned with their individual risk tolerance.