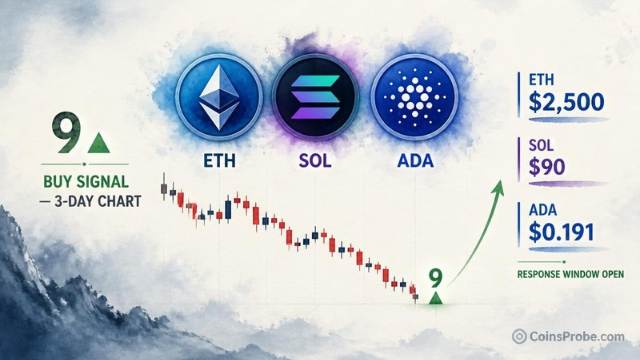
Key Highlights ETH fell 22.64% from $2,806 to $2,171 — TD Sequential buy signal now active on the 3-day chart SOL dropped 27.31% from $124.89 to $90.78 — signal valid only if $90 holds as sup
Key Highlights
ETH fell 22.64% from $2,806 to $2,171 — TD Sequential buy signal now active on the 3-day chart
SOL dropped 27.31% from $124.89 to $90.78 — signal valid only if $90 holds as support
ADA prints both a TD Sequential 9 and S13 simultaneously at $0.191 — double exhaustion signal
ETH spot ETFs logged 5 consecutive outflow days totaling $507.9M — institutional flows not yet confirming
Ethereum is trading at approximately $2,293.42 — up 2.32% in the past 24 hours — with a market cap of $280.2 billion, after suffering a 22.64% correction from $2,806 to a low of $2,171. The TD Sequential has now printed a buy signal on the 3-day chart, a momentum exhaustion indicator that flags when a sustained directional move has statistically run its course.
An analyst, posting as part of a five-tweet thread on November 3, 2026, identified this buy signal simultaneously across three major altcoins — Ethereum, Solana, and Cardano — each having completed a TD Sequential count on the 3-day timeframe following sharp declines. The thread presents a convergent technical case: three separate assets, three separate corrections, one identical exhaustion signal firing at the same time.
The TD Sequential is not a price-level indicator. It does not measure support, resistance, or volume. It counts nine consecutive candles each closing lower than the candle four periods prior — identifying when a directional move has become statistically exhausted, not when buyers have confirmed control. A “9” buy signal means the selling sequence has completed its full count. It is a non-directional exhaustion marker: it says the trend is tired, not that the reversal has begun. The “1” count that follows the signal marks the opening of the response window — the period in which buyers must step in to validate the signal.
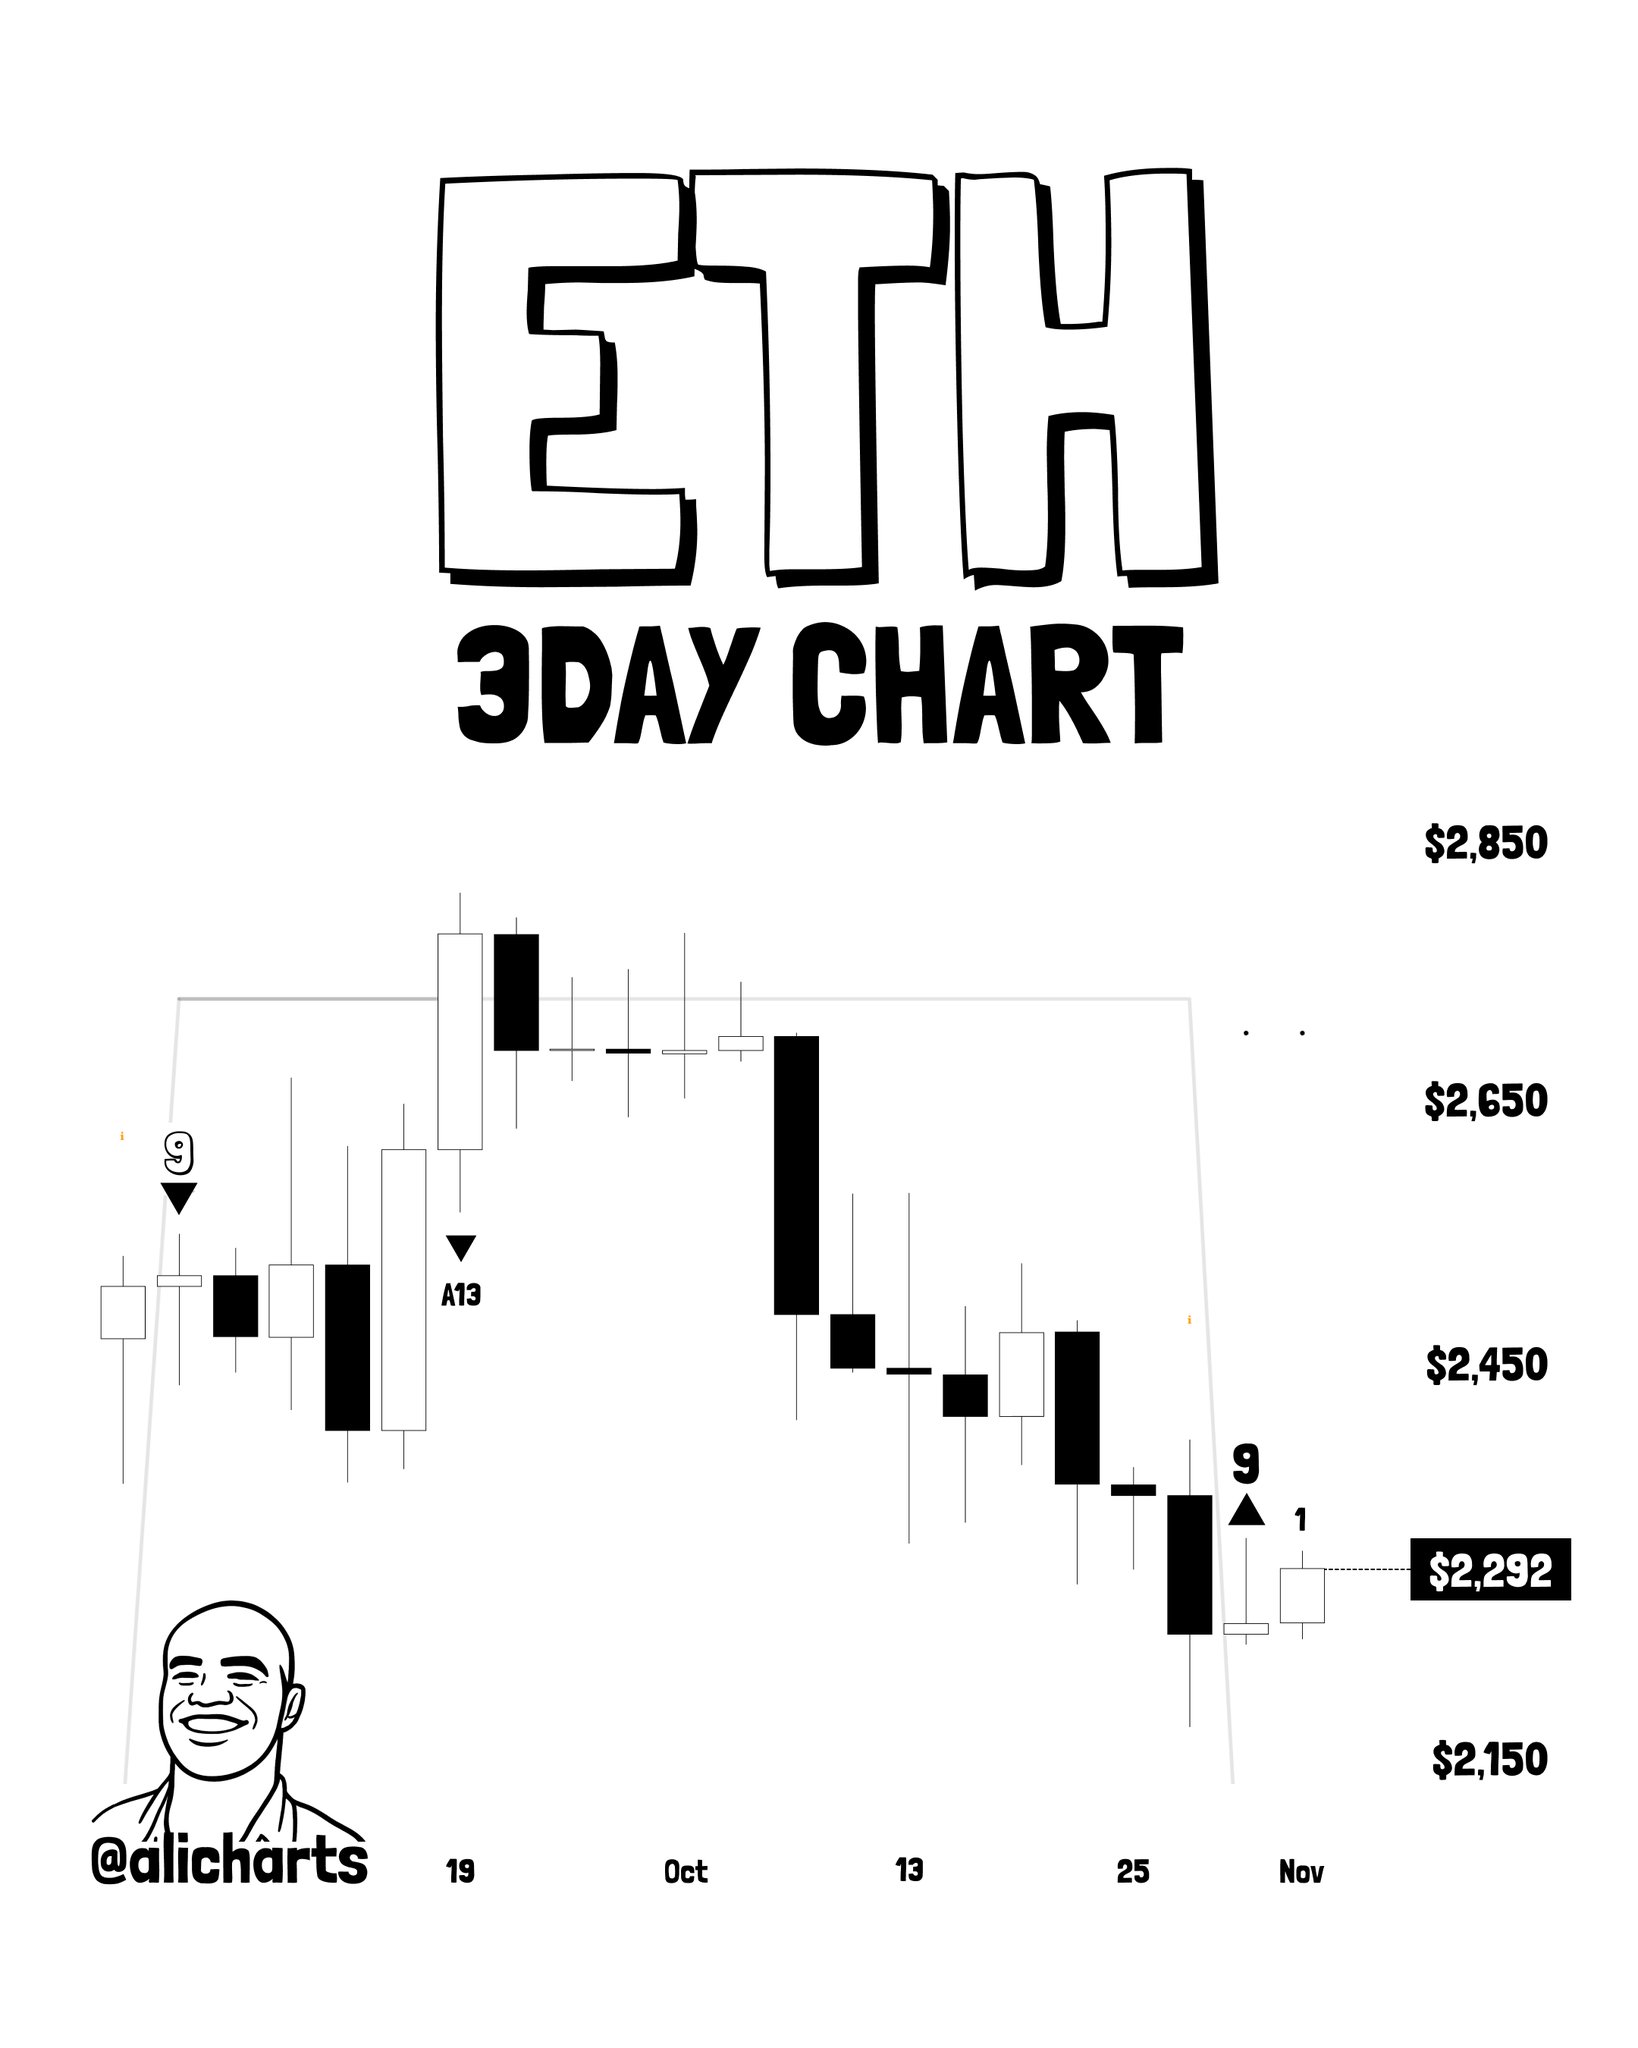
Ethereum fell 22.64% from a high of $2,806 to a low of $2,171 across the correction window. The 3-day chart now shows a completed TD Sequential “9” buy signal at the recent low, with a “1” count candle forming immediately after — the opening of the response window. The chart’s dashed reference line sits at $2,292, consistent with the current trading price at time of writing.
ETH 3-Day Chart Analysis (@alicharts) | Source: @alicharts (X)
The analyst identifies two upside reference levels contingent on buying pressure materializing. The first target is $2,500 — an initial rebound objective. Breaking $2,500 with conviction would then expose the setup resistance trendline near $2,700. These levels are conditional: they require buying pressure to emerge from the signal zone, not a guarantee of its arrival. The pattern remains still forming — no reversal breakout has been confirmed.
ETH spot ETF data from SoSoValue adds a layer of caution. The latest trading session recorded a net outflow of $85.3 million, extending a streak of five consecutive outflow days totaling $507.9 million in net redemptions. ETHA alone accounted for $74.4 million of the latest daily outflow. Institutional flows have not yet pivoted — a condition the TD Sequential signal alone cannot resolve. DeFiLlama data shows Ethereum’s TVL at $43.91 billion, with 24-hour DEX volume at $1.86 billion and 7-day fees of $159.41 million, confirming the network remains operationally active despite the price correction.
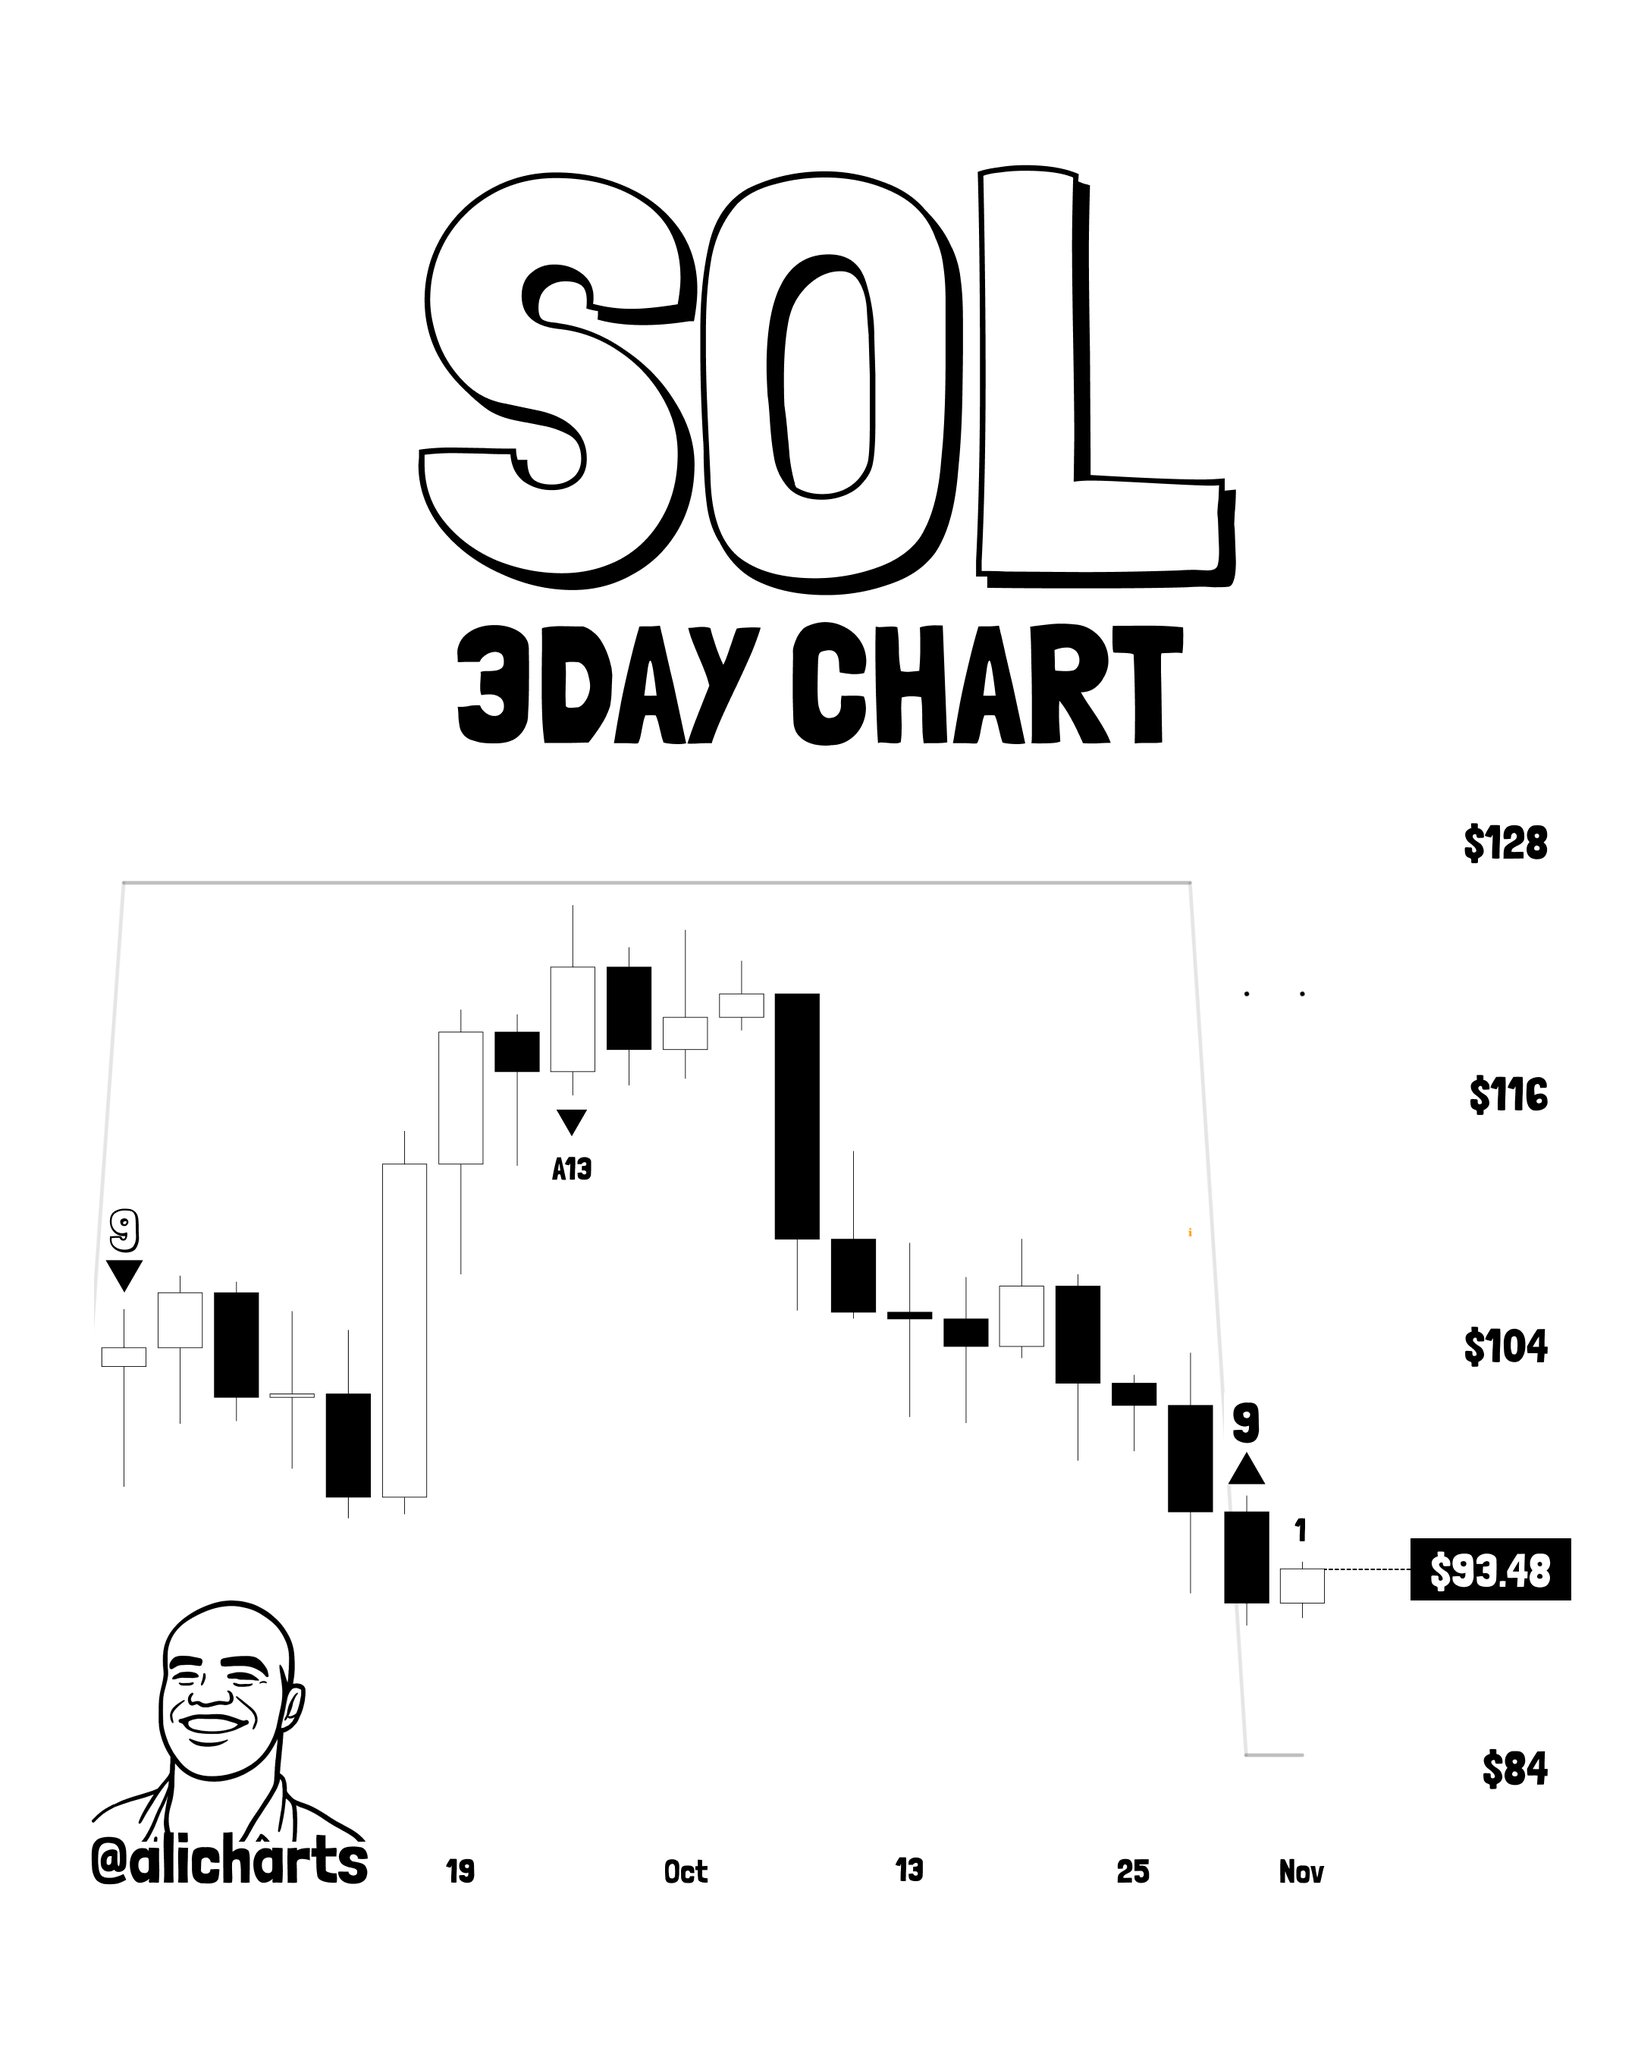
Solana has dropped 27.31% from $124.89 to a low of $90.78. The 3-day chart shows the TD Sequential count progression — labeled 6, A13, 9, 1 — marking a sustained bearish sequence now reaching exhaustion. The chart’s dashed reference line sits at $93.48, with a wick extending toward the $84 zone on the chart’s lower boundary.
SOL 3-Day Chart Analysis | Source: @alicharts (X)
The analyst’s condition for the SOL setup is explicit: the signal is contingent on $90 holding as support. If the $90 level fails to hold, the TD Sequential signal loses its structural foundation. The pattern is still forming — the “1” count has appeared but the full setup has not yet completed, and no breakout above resistance has occurred. The $90 level is the line between a consolidation-at-lows setup and a continued breakdown.
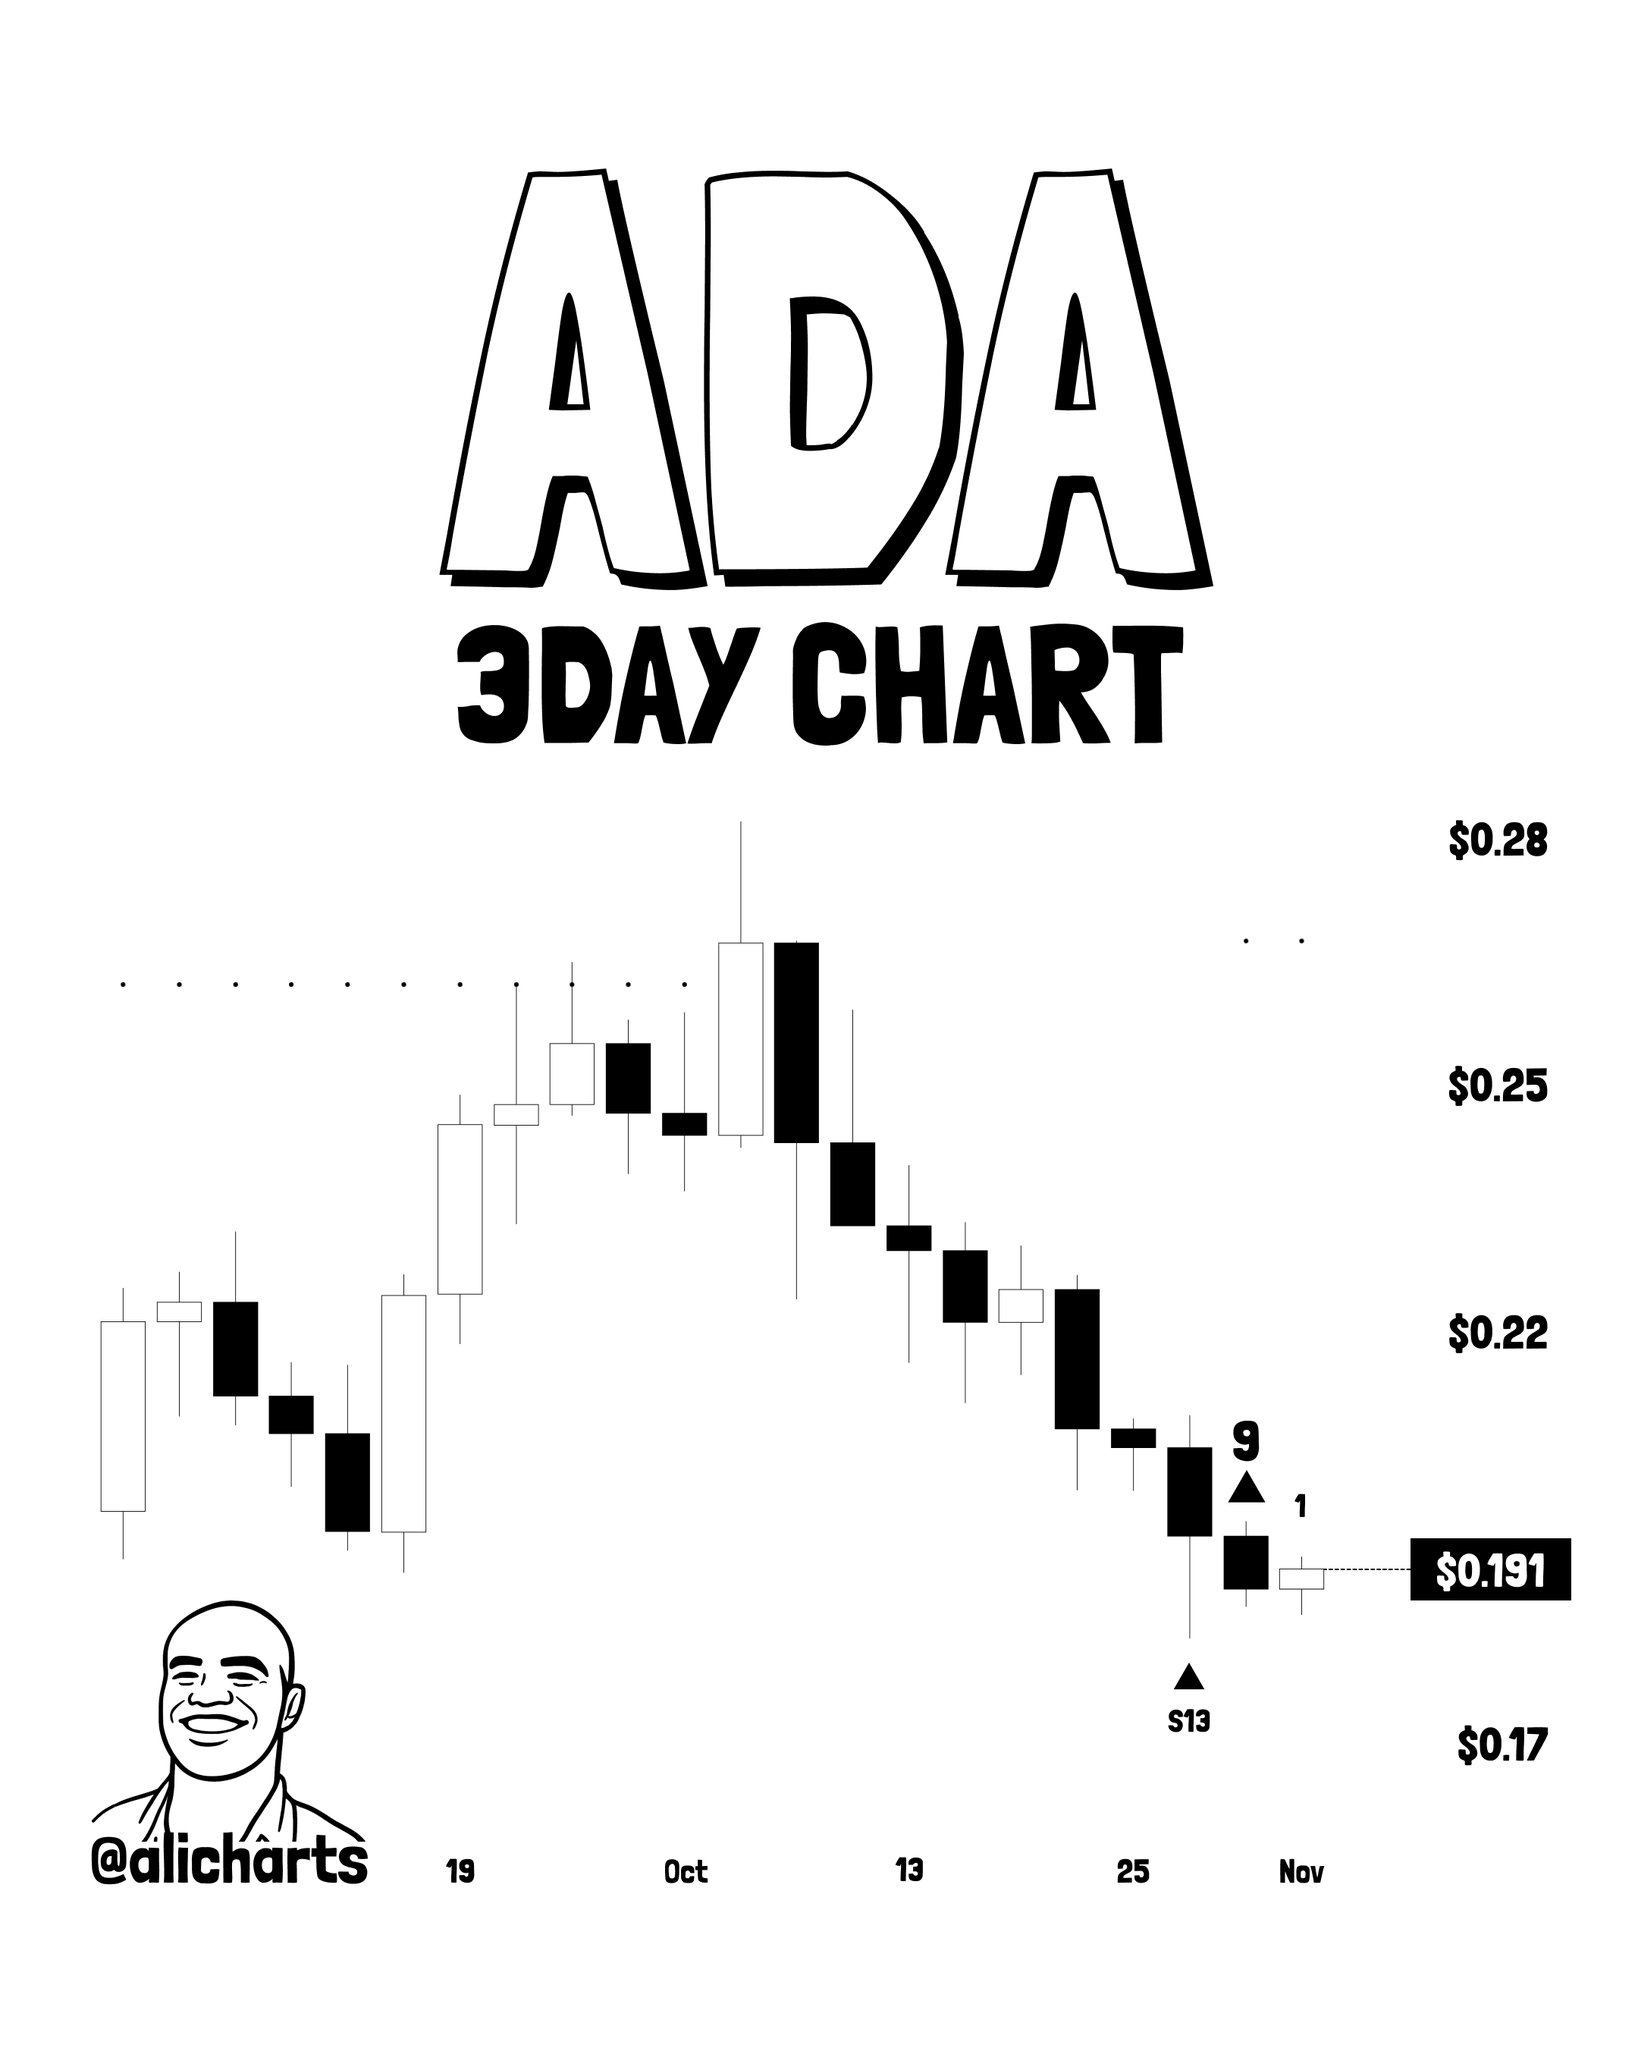
Cardano’s 3-day chart presents the most concentrated signal of the three. At the recent low, the chart shows two TD Sequential exhaustion markers appearing at the same price zone: a “9” count with a triangle marker and an “S13” (Sequential 13) triangle below — two separate exhaustion counts completing simultaneously. The dashed reference line sits at $0.191, with chart price levels spanning $0.17 at the lower boundary to $0.28 above.
ADA 3-Day Chart Analysis | Source: @alicharts (X)
The S13 is a secondary confirmation within the TD Sequential system — it fires when the extended countdown also reaches exhaustion, reinforcing the “9” signal. Having both appear on the same 3-day candle is a compressed double-signal. The pattern remains still forming, with price sitting at the signal zone and no breakout above resistance confirmed.
FOMC rate outlook data from SoSoValue introduces a macro variable the TD Sequential does not account for. Markets are currently pricing a 77.1% probability of a rate hike at the December 9, 2026 FOMC meeting — moving the federal funds rate from 3.75%–4.00% to 4.00%–4.25%. For the January 27, 2027 meeting, cumulative hike probability reaches 83.2%. A tightening rate environment historically compresses risk asset multiples, and altcoins have historically been sensitive to liquidity conditions. Upcoming macro data releases — Nonfarm Payrolls on November 6, CPI on November 10, and PPI on November 13 — each carry the potential to shift those probabilities materially in either direction. The TD Sequential signals flag technical exhaustion. They do not absorb macro shocks.
For broader context on how macro cycles interact with crypto timing, the analysis of Bitcoin’s midterm election signal — 4-for-4 with a +63% median 12-month return is relevant background on how calendar-driven signals interact with broader crypto cycles.
Three altcoins printing the same exhaustion signal within the same timeframe is not coincidental — it reflects a synchronized correction across the altcoin complex, and a synchronized statistical exhaustion of that correction. But the TD Sequential is a timing signal, not a purchase signal. Confirmation requires buyers to respond within the response window. For ETH, that means reclaiming $2,500 to open the path toward $2,700. For SOL, it requires $90 holding and buying volume emerging above $93.48. For ADA, it requires a sustained close above the $0.191 signal zone.
None of these conditions have been met yet. The signals have fired. The response window is open. The next three to six 3-day candles across all three assets will determine whether this is an exhaustion reversal or a continuation after a brief pause.
Watch $2,500 on ETH, $90 on SOL, and $0.191 on ADA — these are the levels that separate signal validation from signal failure.
Disclaimer: The views and analysis presented in this article are for informational purposes only and reflect the author’s perspective, not financial advice. Technical patterns and indicators discussed are subject to market volatility and may or may not yield the anticipated results. Investors are advised to exercise caution, conduct independent research, and make decisions aligned with their individual risk tolerance.
Also Read: Bitcoin Midterm Election Signal — 4-for-4 With +63% Median 12-Month Return