Will ETHFI buyers defend the $0.4708 level, or is a slide toward $0.4038 next? This Ether.fi price prediction begins with ETHFI trading near the bottom of a falling channel that has capped ev
Will ETHFI buyers defend the $0.4708 level, or is a slide toward $0.4038 next?
This Ether.fi price prediction begins with ETHFI trading near the bottom of a falling channel that has capped every rally on the daily chart. The latest slide, set against the widerETHFI 2026 price prediction, leaves buyers a nearby support level.
Ether.fi Price Forecast: 24-Hour Market Snapshot
CoinGecko market data shows ETHFI at $0.4773, down 18.7% over 7 days. The 24-hour range of $0.4762 to $0.5143 leaves a price near the low end of the day's band.
Metric
Value
Price
$0.4773
7-day change
-18.7%
24-hour range
$0.4762 to $0.5143
Market cap
$476.964M
Market cap rank
103th
Fully diluted valuation (FDV)
$476.964M
Circulating supply
998.536M ETHFI
Total supply
998.536M ETHFI
Source: CoinGecko, ETHFI market snapshot, captured Nov 16, 2026, 07:02 UTC
FDV, the value of every token at the current price, equals market cap at $476.964M. With 998.536M of the 1B max supply already circulating, new unlocks add little supply pressure.
Volume of $20.322M is about 4.3% of market cap, so the slide comes on modest turnover.
Ether.fi Price Forecast Risk: Top 5 Wallets Hold 45.82%
Etherscan holders data puts the top 100 wallets at 93.24% of supply and the top 10 at 62.05%. The top 5 alone control 45.82%.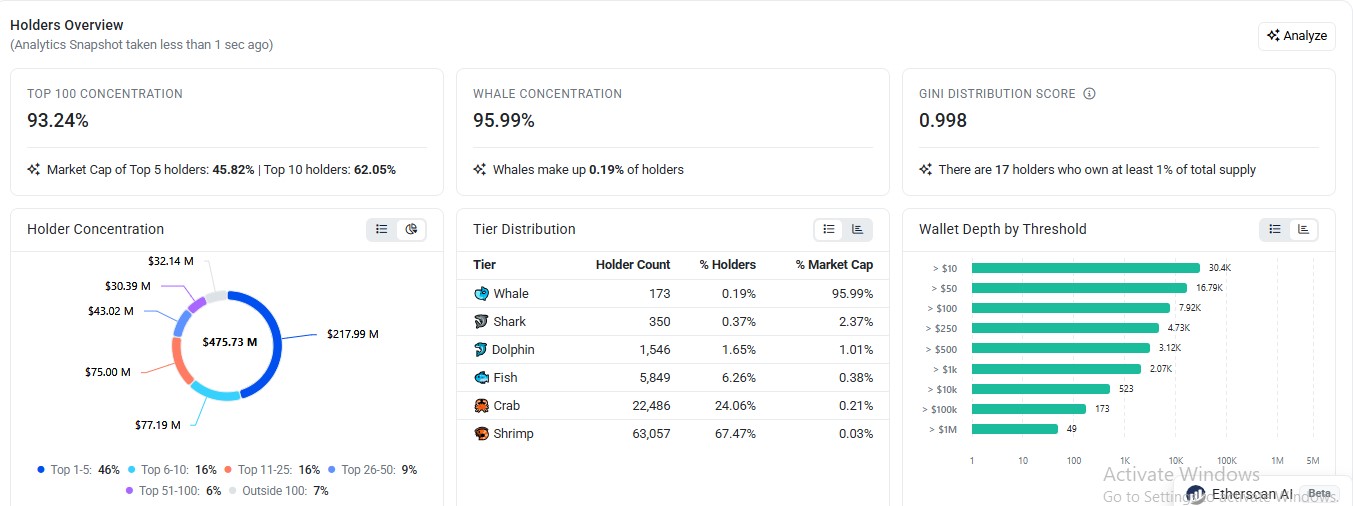
Source: Etherscan, ETHFI holders overview, captured Nov 16, 2026, 07:02 UTC
Whales, the largest wallets, number 173 and hold 95.99% of market cap. Seventeen more wallets each own at least 1% of the supply.
A single large transfer to an exchange could add sell orders faster than $20.322M of daily volume can absorb.
Ether.fi Liquidation Data: Longs Lose $73.41K in 24 Hours
A liquidation is a forced exit once a trade's margin runs out. Long traders took the hit.
Window
Long liquidations
Short liquidations
Total
1h
$5.43K
$0.00
$5.43K
4h
$10.62K
$0.00
$10.62K
12h
$59.27K
$141.96
$59.42K
24h
$73.41K
$6.36K
$79.77K
Source: CoinGlass, ETHFI liquidations, captured Nov 16, 2026, 07:02 UTC
CoinGlass liquidation data shows longs lost $73.41K over 24 hours. Shorts lost only $6.36K, for a total of $79.77K.
Over the last 12 hours, longs took $59.27K in losses against $141.96 for shorts.
But the amounts are small. Long liquidations add forced sell orders, which can push the price lower when volume is thin, yet $79.77K can't explain the 18.7% drop alone.
Ether.fi Open Interest and Volume: $69.05M Across Venues
Open interest is the total value of futures contracts still open.CoinGlass futures data puts it at $69.05M, against $42.68M of 24-hour volume.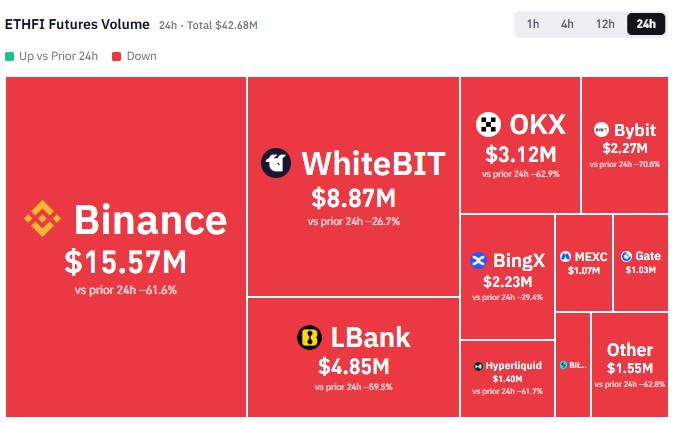
Source: CoinGlass, ETHFI futures volume heatmap, 24h, captured Nov 16, 2026, 07:02 UTC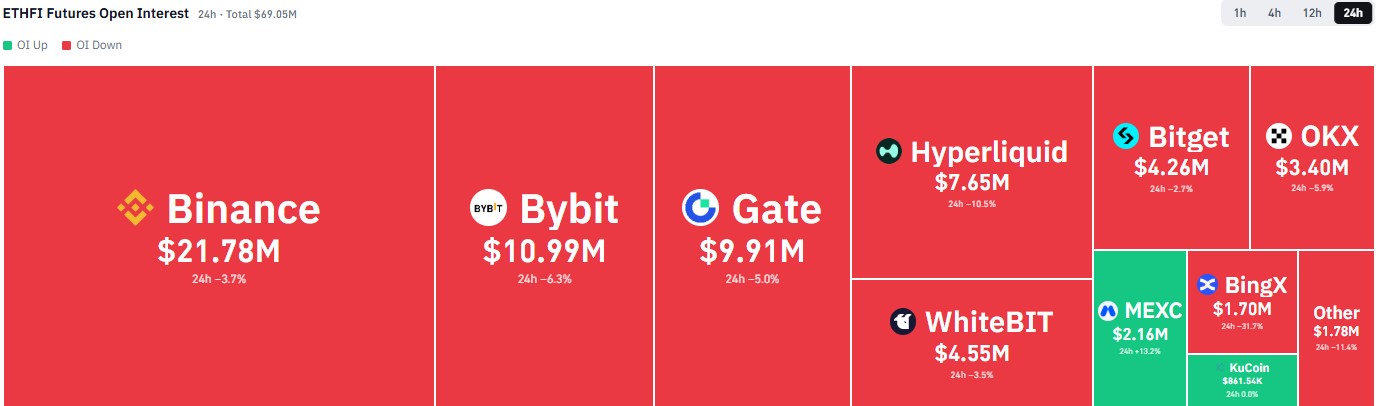
Source: CoinGlass, ETHFI futures open interest heatmap, 24h, captured Nov 16, 2026, 07:02 UTC
Volume is down across the heatmap, down 61.6% on Binance and 70.8% on Bybit against the prior day. And open interest fell on most venues, with only MEXC adding exposure at 13.2%.
Falling open interest alongside a falling price means traders are exiting positions, not adding new ones.
Ether.fi Technical Analysis: 50-Day EMA and RSI Levels
The Binance daily chart for $ETHFI/USDT on TradingView frames this Ether.fi price prediction. A September rally pushed ETHFI up toward the $0.7860 resistance level before sellers took control.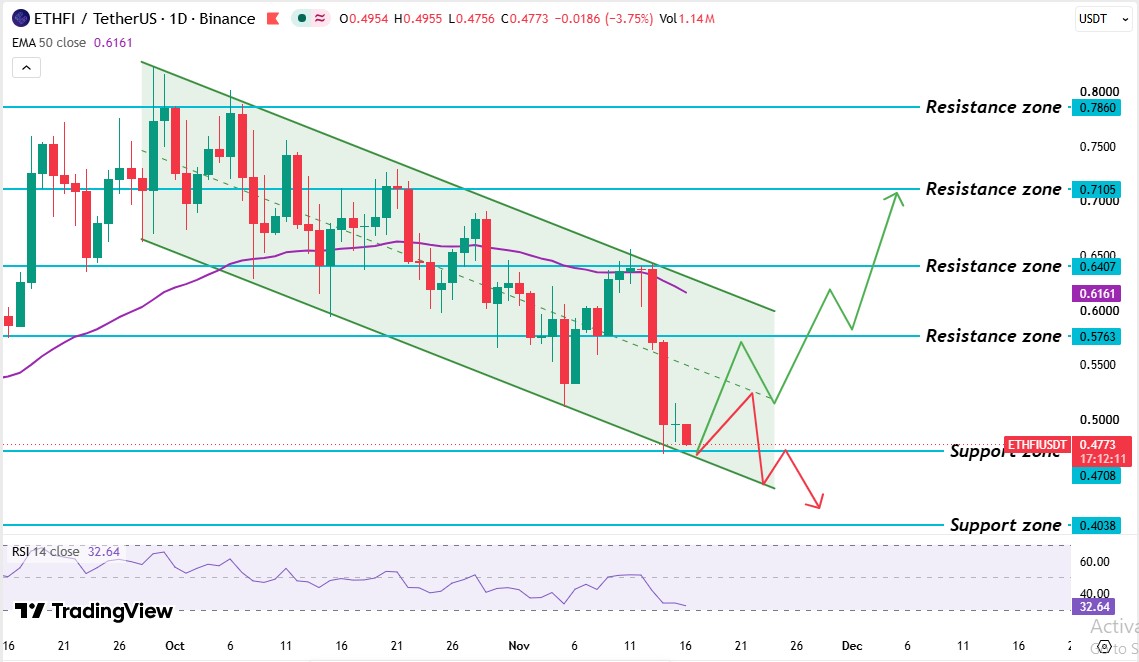
Source: TradingView, Binance $ETHFI/USDT 1D chart with EMA 50 and RSI 14, captured Nov 16, 2026, 07:02 UTC
From there, the price slid inside a falling channel, two downward-sloping lines that contain the price. A break above the upper line favors buyers, and a break below the lower line favors sellers.
Rallies kept stalling under the $0.7105 resistance level in October. Readers trackingETHFI resistance levels will see that buyers pushed into the $0.6407 resistance level twice and failed both times.
Then the price fell hard. The daily candles broke below the $0.6161 50-day EMA and the $0.5763 level, a zone price had traded around in early November. A support level that breaks often becomes a resistance level, so $0.5763 now caps rebounds.
The drop stopped near the lower channel line at the $0.4708 support level, where buyers need to step in. Right now, ETHFI trades just above it and well below the $0.5763 resistance level and the 50-day EMA.
The $ETHFI 50-day EMA sits at $0.6161. ETHFI's $0.4773 price trades 22.3% below it, and the latest candle trades below the EMA too, and the broken $0.5763 level sits just below it, so recovery needs a daily candle trading above both.
The $ETHFI RSI reads 32.64 on the 14-day setting. A reading under 50 means sellers hold the edge. Above 30, oversold conditions, where selling has gone too far, haven't formed, so price has room to fall.
Ether.fi Support and Resistance Levels
Level
Type
$0.7860
Resistance level
$0.7105
Resistance level
$0.6407
Resistance level
$0.6161
50-day EMA
$0.5763
Resistance level
$0.4708
Support level
$0.4038
Support level
A support level holds price up, and a resistance level caps it. The nearest levels sit at $0.4708 below and $0.5763 above.
Ether.fi Price Forecast: Bull, Base, and Bear Scenarios
Scenario
Trigger
Target
Invalidation
Bull
Daily candle trades above $0.6407
$0.7105 then $0.7860
Falls back below $0.6407
Base
Price stays between $0.4708 and $0.5763.
Sideways trade inside that range
A daily candle breaks either level.
Bear
Daily candle trades below $0.4708
$0.4038 support level
Daily candle trades above $0.5763
Risks to this Ether.fi price prediction run both ways. A regulatory delay or shock can hit DeFi tokens fast. And a daily candle trading above $0.5763 would invalidate the bearish case, while a break below $0.4708 would confirm it.
Ether.fi Price Prediction: Expert Outlook
As per CoinGabbar Analysis, the Ether.fi price prediction leans bearish while ETHFI trades below the $0.6161 50-day EMA. A bounce from $0.4708 seems tempting at first glance.
But the RSI at 32.64 hasn't reached oversold condition yet, and $73.41K of long liquidations means buyers are still being forced out.
Whale holdings add event risk. That makes thelatest crypto news worth a check alongside the chart. The condition to monitor is the daily candle at the $0.4708 support level, since a candle trading below it confirms a channel breakdown.
Disclaimer: This article is for information only and isn't financial advice. Traders should do their own research and risk only what they can afford to lose.