Ethereum price has finally reclaimed the $1,800 resistance after spending weeks trading below the level, marking one of its strongest technical developments in recent sessions. The breakout c
Ethereum price has finally reclaimed the $1,800 resistance after spending weeks trading below the level, marking one of its strongest technical developments in recent sessions. The breakout comes as market participation accelerates, with a high-profile trader opening a $24.3 million leveraged long position on ETH. The move has quickly shifted traders’ attention toward the next major psychological milestone at $2,000. But is this breakout backed by enough conviction to sustain another leg higher?
Ethereum Breaks Key Resistance, Eyes Next Major Hurdle
Ethereum’s recent breakout above the $1,800 resistance zone marks an important shift in short-term market structure after weeks of consolidation. The move was accompanied by higher trading volume, suggesting that buyers stepped in with conviction rather than the rally being driven solely by low liquidity.
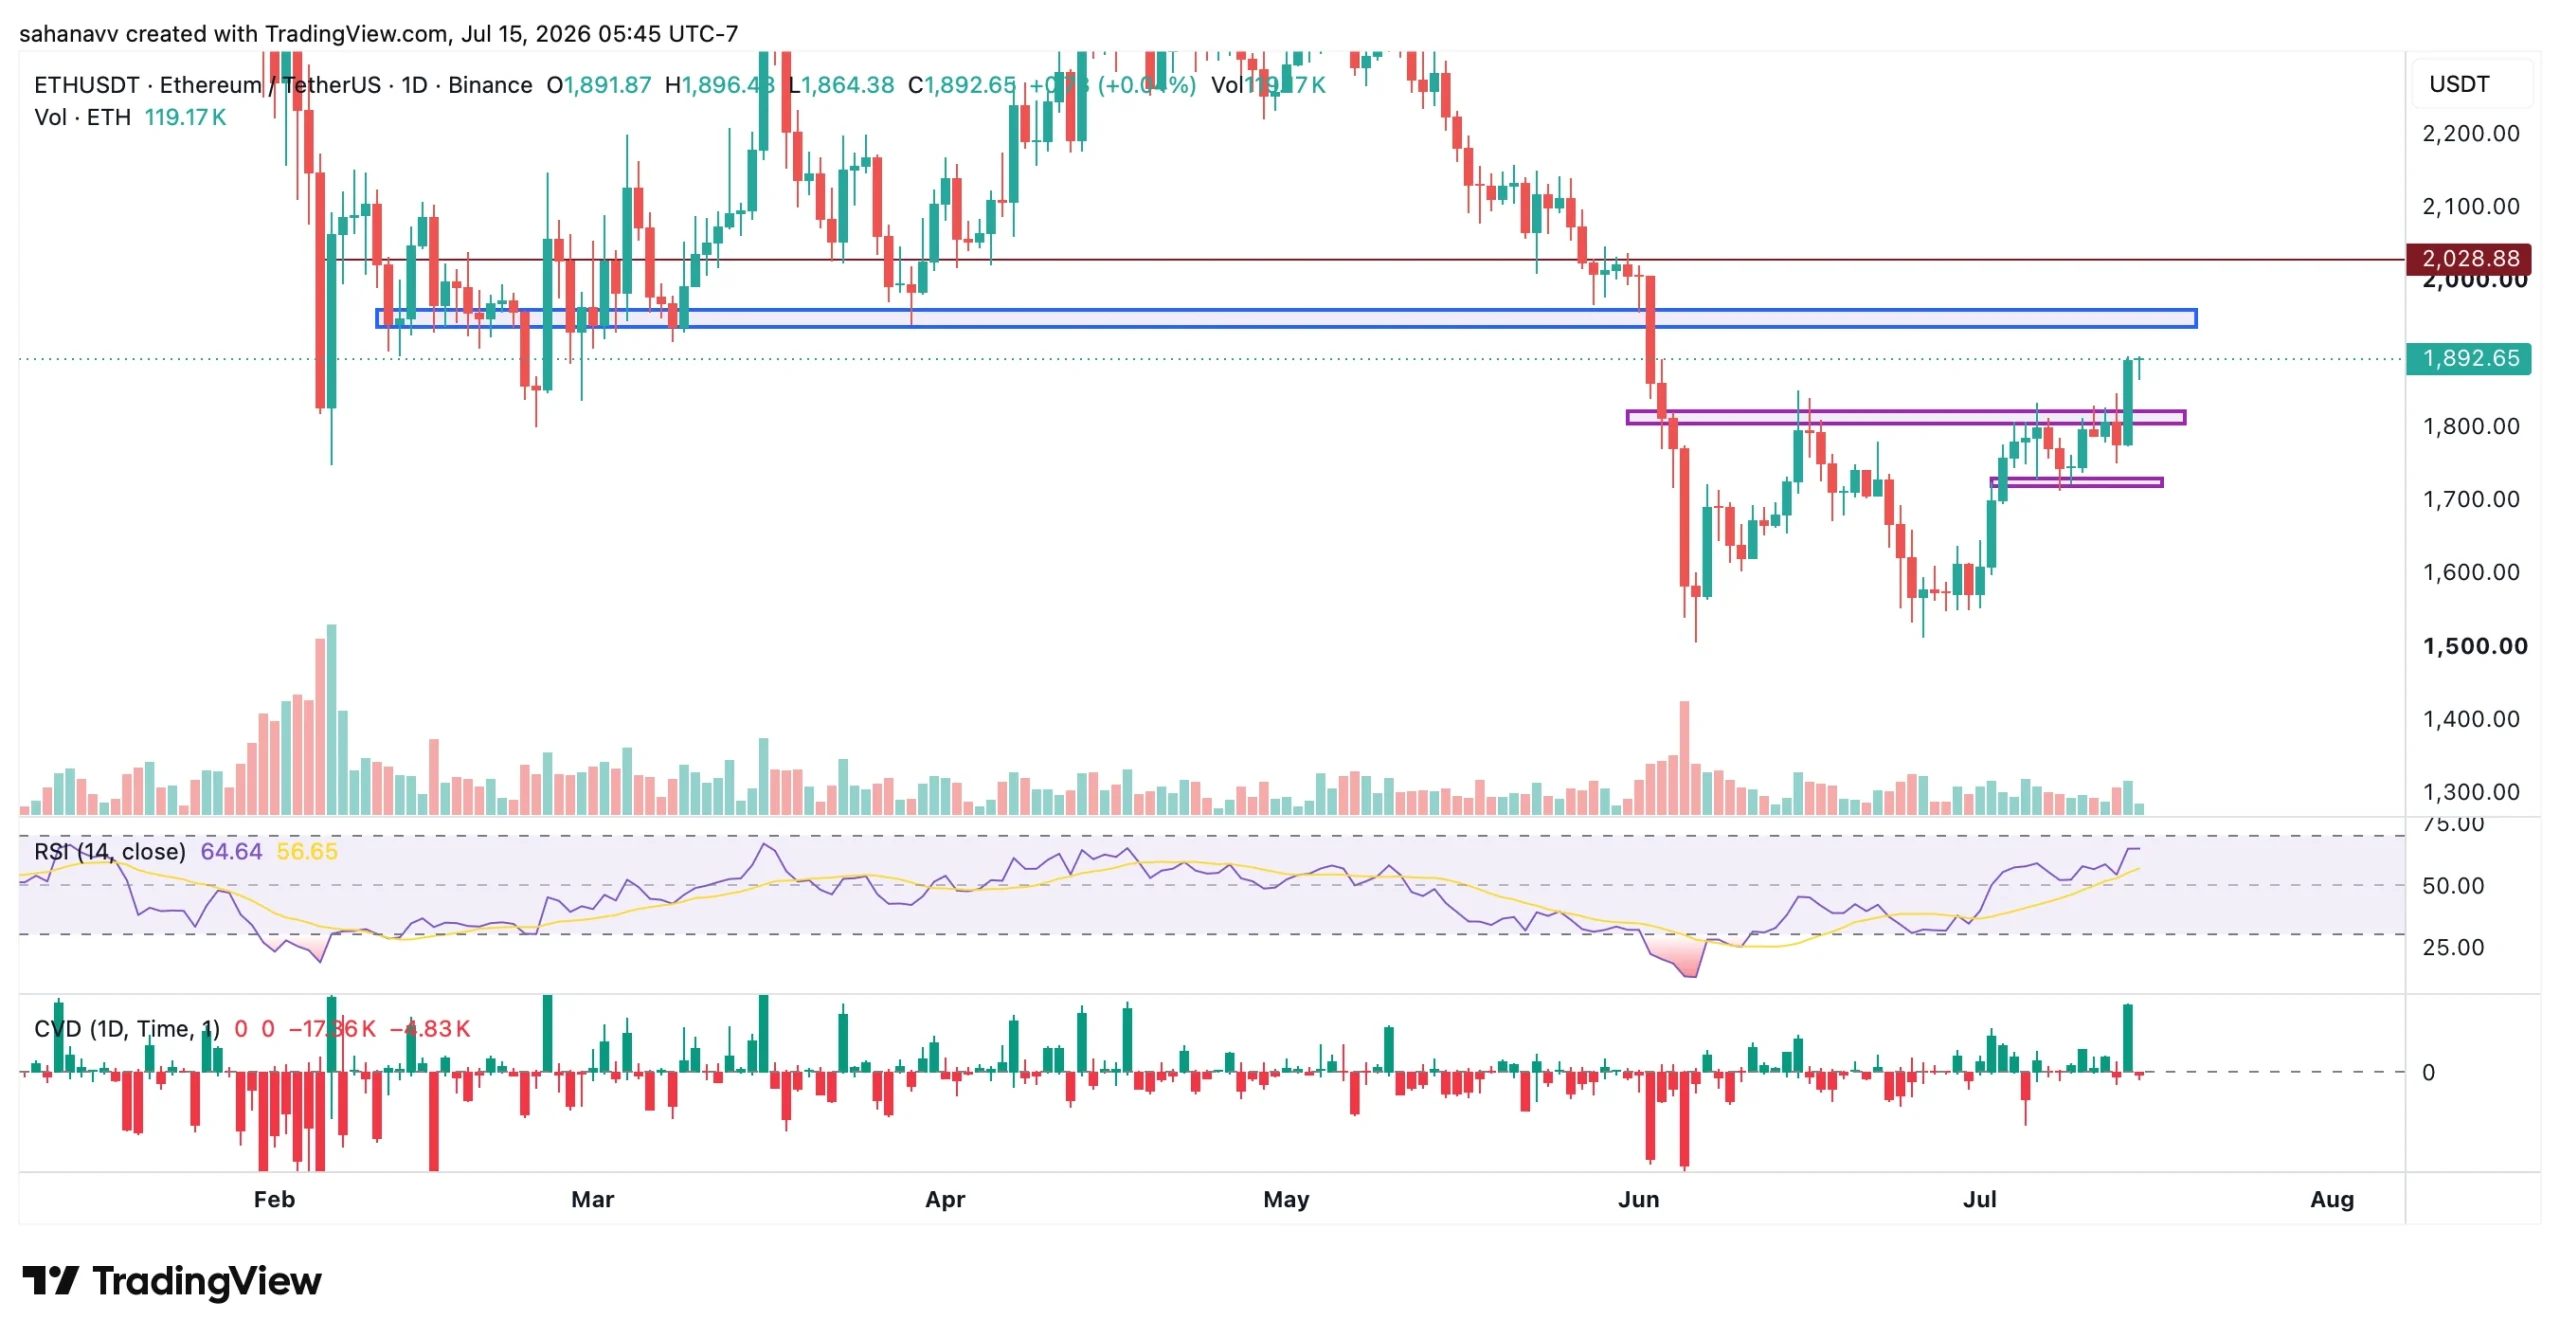
Momentum indicators also support the bullish outlook. The daily RSI has climbed above 60, reflecting strengthening buying pressure while remaining below overbought territory. Meanwhile, Cumulative Volume Delta (CVD) has turned higher, indicating that aggressive market buyers are increasingly lifting offers rather than passively waiting for lower prices. This alignment between rising prices and CVD adds credibility to the breakout by showing that buying pressure is supporting the move.
However, bulls still face a critical test ahead. The next major resistance lies between $1,940 and $1,970, a region that previously served as support before turning into a supply zone following June’s sharp decline. A sustained move above this range could strengthen the case for a broader recovery toward the psychological $2,000 level, while rejection may encourage sellers to regain control.
Can ETH Sustain Its Breakout? Here’s What Traders Are Watching
The bullish momentum has also been reflected in the derivatives market, where prominent crypto whale Machi Big Brother recently opened a $24.3 million Ethereum long position with 25x leverage. While such high-profile trades often attract market attention, they should not be viewed as standalone buy signals. Instead, they provide insight into how sophisticated traders may be positioning around key technical levels.
Liquidation data suggests there is a cluster of short positions above the current price, creating the potential for a short squeeze if Ethereum continues higher. At the same time, a much larger pool of long liquidations remains below the market, indicating that any failure to hold the recent breakout could trigger an equally sharp move in the opposite direction.
The Bottom Line
Ethereum price recovery has gained momentum after reclaiming a key resistance zone, with improving volume, rising CVD, and renewed whale activity reinforcing the short-term bullish narrative. Even so, the $1,940–$1,970 resistance range remains the defining level for the current trend.
A breakout above this zone could strengthen the case for a move toward $2,000, while rejection may shift attention back to the $1,800 support.