Ethereum Classic price prediction October 2026 searches are picking up, and ETC has been building something traders keep returning to. One level decides whether it pays off, and another decid
Ethereum Classic price prediction October 2026 searches are picking up, and ETC has been building something traders keep returning to. One level decides whether it pays off, and another decides whether the idea is dead.
The editorial desk holds no personal position in this coin. This is purely a chart and data read.
Quick answer: For the Ethereum Classic price prediction October 2026, ETC trades at $8.95. A daily close above $10.08 targets $18.85, then $25.90, while a daily close below $6.02 invalidates the setup.
ETC Price Today: Live Market Data and Open Interest Snapshot
The current market price (CMP) is $8.95. Market cap sits at $1.41B. Futures volume over 24h is $62.22M against spot volume of $8.22M.
Open interest, the total value of futures contracts still open, stands at $129.74M. Circulating supply is 158.38M coins out of a 210.70M maximum.
This update rests on chart and derivatives data, so anyone following Ethereum Classic news today should read it as a technical view, not a reaction to an event.
Source: CoinGlass, Oct 5, 2026, 10:30 AM.
ETC Market Outlook: Liquidations, Open Interest, and Positioning
Futures volume of $62.22M is about 7.6 times the spot volume of $8.22M. Over 24h, $127.15K was liquidated, split $110.47K in longs and $16.68K in shorts. 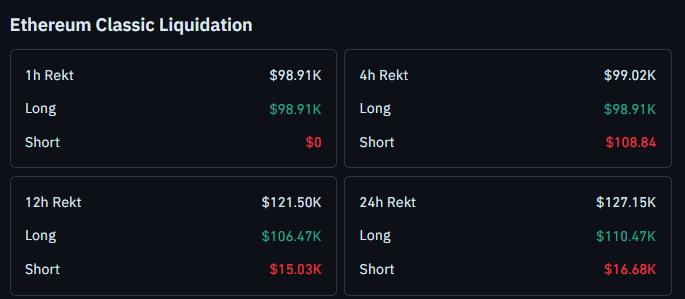
Most of it hit in the 1h window: $98.91K of longs and $0 of shorts. Against $129.74M of open interest, that is a small flush, more like a few overleveraged buyers shaken out than a broad washout.
Source: CoinGlass, Oct 5, 2026, 10:30 AM.
Key Takeaways: ETC Price Target and Breakout Levels at a Glance
CMP is $8.95 on the daily Binance chart.
Price holds an ascending trendline after a higher high.
A daily close above $10.08 targets $18.85, then $25.90.
A daily close below $6.02 invalidates the setup.
Ethereum Classic Technical Analysis: Trendline Support, Daily Chart
Methodology: ETC/USDT, daily timeframe, Binance, with RSI divergence as the indicator. The setup is invalid on a daily close below $6.02.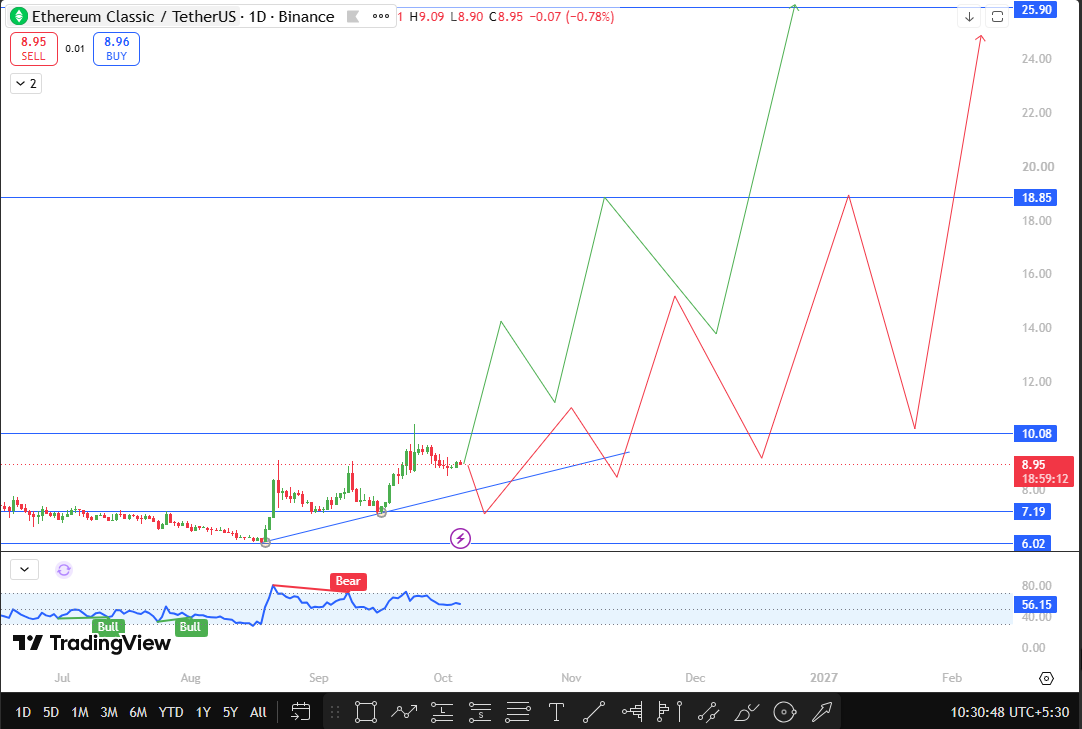
After a quiet summer near the lows, Ethereum Classic began climbing along an ascending trendline. Each of the two touches led to a higher high.
The latest push was turned back at the $10.08 area; the price pulled back, held the structure, and has started moving up again from $8.95.
RSI divergence reads 56.15. Two bullish labels appeared in July and August, before the rally began. A bearish label followed in September, when the price made a higher high, but RSI divergence showed a lower peak.
That is the main caution in this ETC technical analysis. The wider trend analysis stays constructive while the price holds above the line.
Ethereum Classic Price Forecast: Support and Resistance Levels Ahead
Level
Type
Importance
Distance From CMP
$25.90
Resistance
Major target
+189.39%
$18.85
Resistance
Second upside target
+110.61%
$10.08
Resistance
Breakout trigger
+12.63%
$8.95
CMP
Current price
0%
$6.02
Support
Setup invalidation
-32.74%
ETC Forecast October 2026: Bullish, Base, and Bearish Scenarios
Bullish Scenario: Daily Close Above $10.08 Opens $18.85 and $25.90
Confirmation needs a daily close above $10.08, the level that turned price back last time. The first ETC price target is $18.85, with major resistance at $25.90. A retest that holds the trendline makes the breakout cleaner, while a daily close back under $10.08 weakens it.
Base Scenario: Range Between $6.02 and $10.08 With Trendline Support
If neither level breaks on a daily close, price keeps ranging inside this wide band. Another bounce off the trendline keeps the rising lows intact. Repeated rejections at $10.08 would show buyers tiring.
Bearish Scenario: Daily Close Below $6.02 Invalidates the Setup
A daily close below $6.02 cancels the bullish read. The chart carries no downside target, since the setup simply stops working there. The move gains weight if the price first loses the trendline and cannot reclaim it and loses weight if buyers push the price back above $6.02 quickly.
Risks to the ETC Price Prediction and Setup Invalidation Rules
The price was already turned back at $10.08 once, and nothing guarantees a second attempt will go differently. Both upside targets sit far away, at +110.61% and +189.39% from CMP, so this is a long-range setup.
With no confirmed Ethereum Classic news behind the move, a breakout that fails to hold can fall back to the trendline fast. A daily close below $6.02 ends the idea.
Ethereum Classic Trend Analysis: Conclusion and Next Price Move
Price has respected its ascending trendline, made a higher high, and is climbing again from $8.95.
Everything in the $ETC forecast now hinges on $10.08. A daily close above it puts $18.85 and $25.90 in play, while a daily close below $6.02 ends the setup.
Disclaimer: Educational Chart Analysis, Not Financial Advice
Educational content only, not financial advice. Crypto markets are volatile, so do your own research before trading.