TLDR: Ethereum price prediction is bearish below the 50-day SMA, with $2,370 support and the 100-day average near $2,200 shaping the next levels to watch. U.S. spot Ethereum ETFs shed about $
TLDR:
- Ethereum price prediction is bearish below the 50-day SMA, with $2,370 support and the 100-day average near $2,200 shaping the next levels to watch.
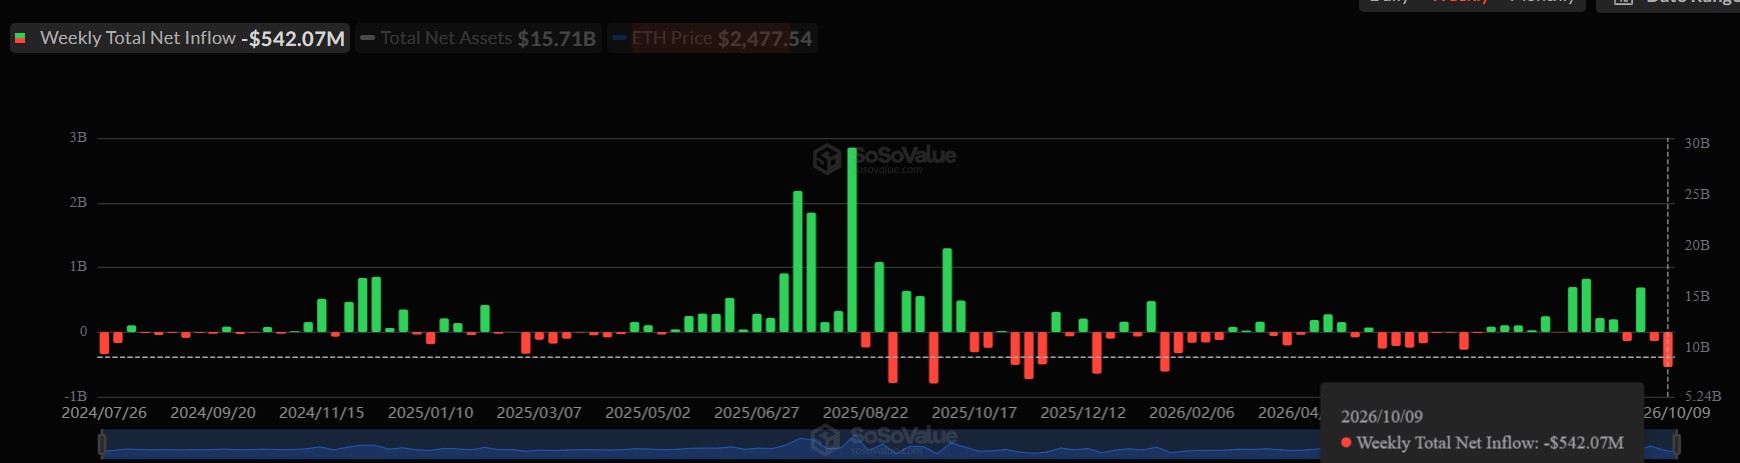
- U.S. spot Ethereum ETFs shed about $542 million in the week ended October 9, their largest weekly outflow since late January.
- BlackRock’s ETHA accounted for roughly $477 million in weekly withdrawals, while total U.S. Bitcoin ETF outflows reached $681 million.
- Whales reportedly added more than 166,000 ETH in 72 hours even as exchange balances rose 90,000 ETH and futures open interest declined.
Ethereum price prediction has weakened recently. Ether fell below its 50-day simple moving average. U.S. spot Ethereum ETFs logged their largest weekly outflow since January. ETH traded near $2,491 on October 10. It was down more than 7% in seven days, while trading volume fell 61% to $7.2 billion.
Yet whale data offered a counterpoint: holders added about 166,000 ETH over 72 hours, alongside Bitcoin and XRP purchases. The conflicting signals leave traders watching $2,370 support for now. A break could expose the $2,200 area, while a defense may steady the market. ETF redemptions and rising exchange balances remain risks.
 Ethereum (ETH) Price
Ethereum Price Prediction Weighs ETF Outflows Against Whale Buying
U.S. spot Ethereum ETFs saw approximately $542 million in net withdrawals for the week ended October 9, SoSoValue data showed. It was their largest outflow since late January. BlackRock’s iShares Ethereum Trust, known as ETHA, accounted for about $477 million. It was the fund’s largest weekly withdrawal since December 2025. Bitcoin ETFs saw pressure, with $681 million leaving during the period.
Source: SosoValue
These Ethereum ETF outflows point to reduced exposure. They do not show every investor is selling ETH. However, they weaken a key source of demand during a price decline. An outflow streak could cap attempts to recover above resistance. Whale accumulation complicates that bearish picture. Analyst Ali Martinez says large wallets added roughly 15,000 BTC and more than 166,000 ETH. They also added about 45 million XRP in 72 hours.
Whale balances can rise while smaller holders or funds distribute coins. For the Ethereum price prediction, this divergence matters. Wallet demand may absorb some supply without quickly reversing ETF outflows or retail selling. Traders need follow-through in spot buying to treat the signal as durable.
ETF flows and wallet data track different activity. ETF figures capture listed-product flows; whale estimates track large on-chain balances. Those signals can diverge if ETF investors withdraw while other holders accumulate.
The Ethereum price prediction depends on whether whale buying continues beyond the 72-hour window. Continued purchases could absorb some supply, but a pause would leave ETF redemptions as the clearer demand signal.
Exchange Inflows and Futures Deleveraging Add Pressure on ETH
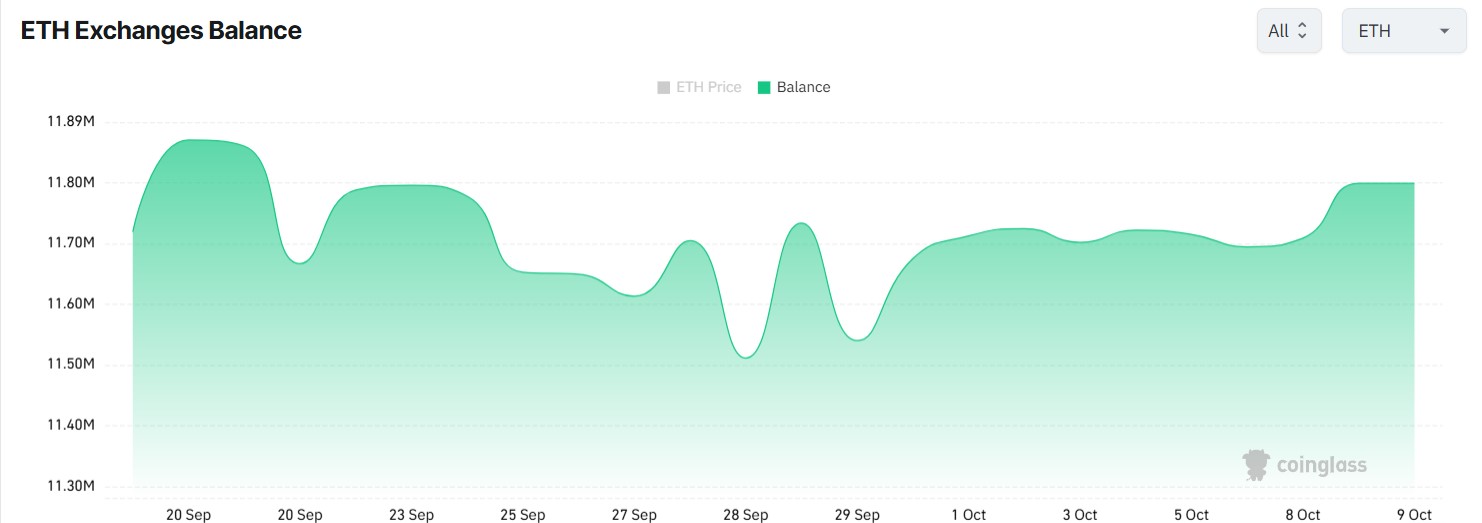
Exchange data adds caution. CoinGlass figures show Ethereum balances on trading platforms rising from 11.71 million ETH on October 8. They reached 11.8 million the next day. That 90,000-ETH increase marked the highest balance since September 23. Coins transferred to exchanges may be prepared for sale, but transfers alone do not prove liquidation. At the same time, open interest fell from 13.29 million to 12.77 million ETH.
Source: Coinglass
Lower futures open interest points to reduced outstanding positions and possible deleveraging. It can ease liquidation risk, but it also signals weaker appetite for leveraged longs. Combined, rising exchange balances and lower OI suggest traders are reducing exposure as spot supply increases. For the Ethereum price prediction, exchange balances now add another warning.
On the daily chart, ETH’s relative strength index slipped to 39, its lowest reading since June. Price also moved below the 50-day SMA. The $2,500 level has also turned into overhead resistance after ETH fell beneath it. The ETH price forecast hinges first on $2,370. A daily close below that support would strengthen the bearish case.
It would put the 100-day SMA near $2,200 in view. This Ethereum price prediction would need confirmation from continued selling or weak demand. If buyers defend $2,370, ETH could consolidate instead. A recovery above the 50-day average would give bulls a stronger signal. ETH had not reclaimed it by publication.
The post Ethereum ETFs Post Biggest Weekly Outflows Since January as Price Breaks Below $2,500 appeared first on Blockonomi.