Ethereum is currently trading around the $1.8K mark. ETH’s longer-term momentum is controlled by sellers. The short entry of the largest altcoin, Ethereum (ETH), is at $1,900.12, closed at $1
- Ethereum is currently trading around the $1.8K mark.
- ETH’s longer-term momentum is controlled by sellers.
The short entry of the largest altcoin, Ethereum (ETH), is at $1,900.12, closed at $1,871.93, banking +1,465.72 USDT. Analysing the setup, once the asset lost structure, the sellers would step in, and the price is flushed directly into the support zone. Entry, target, and invalidation were all mapped before the move began.
On the other hand, ETH hit an all-time high of $4,953.73 in August 2025, one year ago. At $1.8K today, it is sitting 61.93% below that peak. That gap between where it was and where it trades now is either the market’s biggest overhang or its most compelling long-term setup, depending on the timeframe.
Ethereum price is currently hovering within the $1,886 range, with a market cap of $227.59 billion. Moreover, the asset’s daily trading volume is positioned at $8.08 billion. The session ranged between a low of $1,852 and a high of $1,895. Also, the ETH market has seen $33.88 million in 24-hour liquidations.
Looking at the ETH Chart for the Direction Ahead
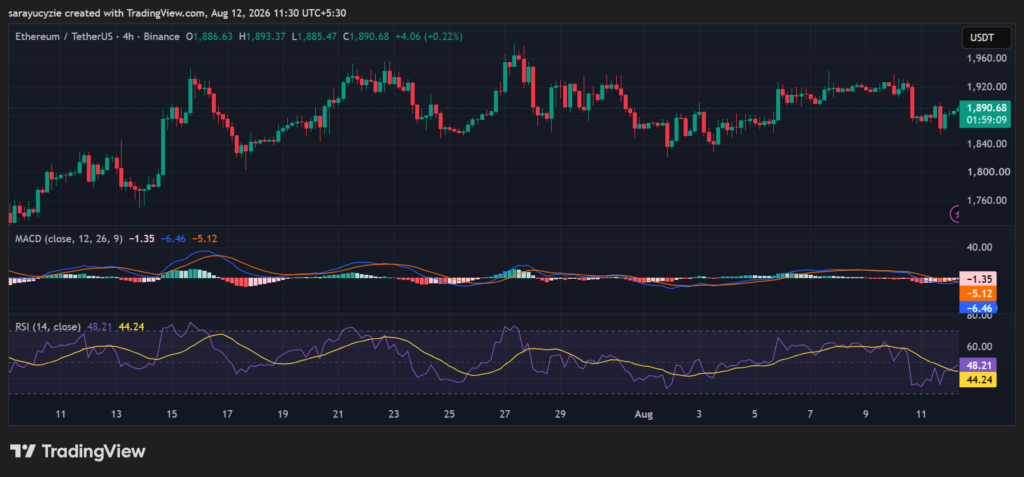
If the bullish momentum of ETH gains traction, the price might move upward to the $1,898 resistance range. Another steady and sturdy push on the upside could likely pressure the momentum and trigger the golden cross to emerge, letting the asset trade above the $1,911 zone.
On the flip side, assuming the Ethereum bears entered the market, it might initiate a downside movement, with the nearest support level at around $1,874. Upon further breakdown, the death cross would take place and drive the altcoin price toward $1,861 or even lower.
Zooming in at the 4-hour technical chart, ETH’s Moving Average Convergence Divergence (MACD) line is found below the signal line, and the short-term selling is moving faster than the average trend rate. As both lines are below zero, the broader market is firmly in a downtrend.
The longer-term momentum is entirely controlled by sellers. There is no conflict; both short-term and long-term momentum are aligned in driving the price lower. The path of least resistance is firmly down, making buying or going long risky until a reversal crossover forms.
 (Source: TradingView)
Besides, Ethereum’s daily Relative Strength Index (RSI) reading at 48.21 indicates a neutral market with a slight bearish tilt. It is showing a balanced tug-of-war between the buyers and the sellers as it sits near the 50 midline. The price is practically at equilibrium; neither buyers nor sellers have strong momentum.
With the short-term selling pressure, it is marginally stronger than buying pressure, but not enough to drive a strong downward trend. The market is consolidating sideways before establishing a major directional move. Traders wait for a break above 50 for a bullish signal or drop below 40 for accelerating bearish momentum.
Crypto Market Highlights
XRP Is Clinging to $1.00: This Battle Line Decides Where the Price Goes Next