Key Highlights Ethereum is currently priced at $1,920.43 with a total market capitalization of $231.76 billion Monthly charts show two TD Sequential Buy signals (Black 9 and S13) have trigger
Key Highlights
- Ethereum is currently priced at $1,920.43 with a total market capitalization of $231.76 billion
- Monthly charts show two TD Sequential Buy signals (Black 9 and S13) have triggered
- The critical support zone between $1,800 and $1,850 has successfully defended against recent pullbacks
- Major resistance levels are positioned between $1,980 and $2,000, followed by a secondary target at $2,100
- Weekly net inflows into spot Ethereum ETFs reached $244.94 million, marking the strongest performance in four months
Ethereum is currently hovering near $1,920.43, maintaining its position above a crucial support area while monthly technical indicators suggest a potential shift in trend direction.
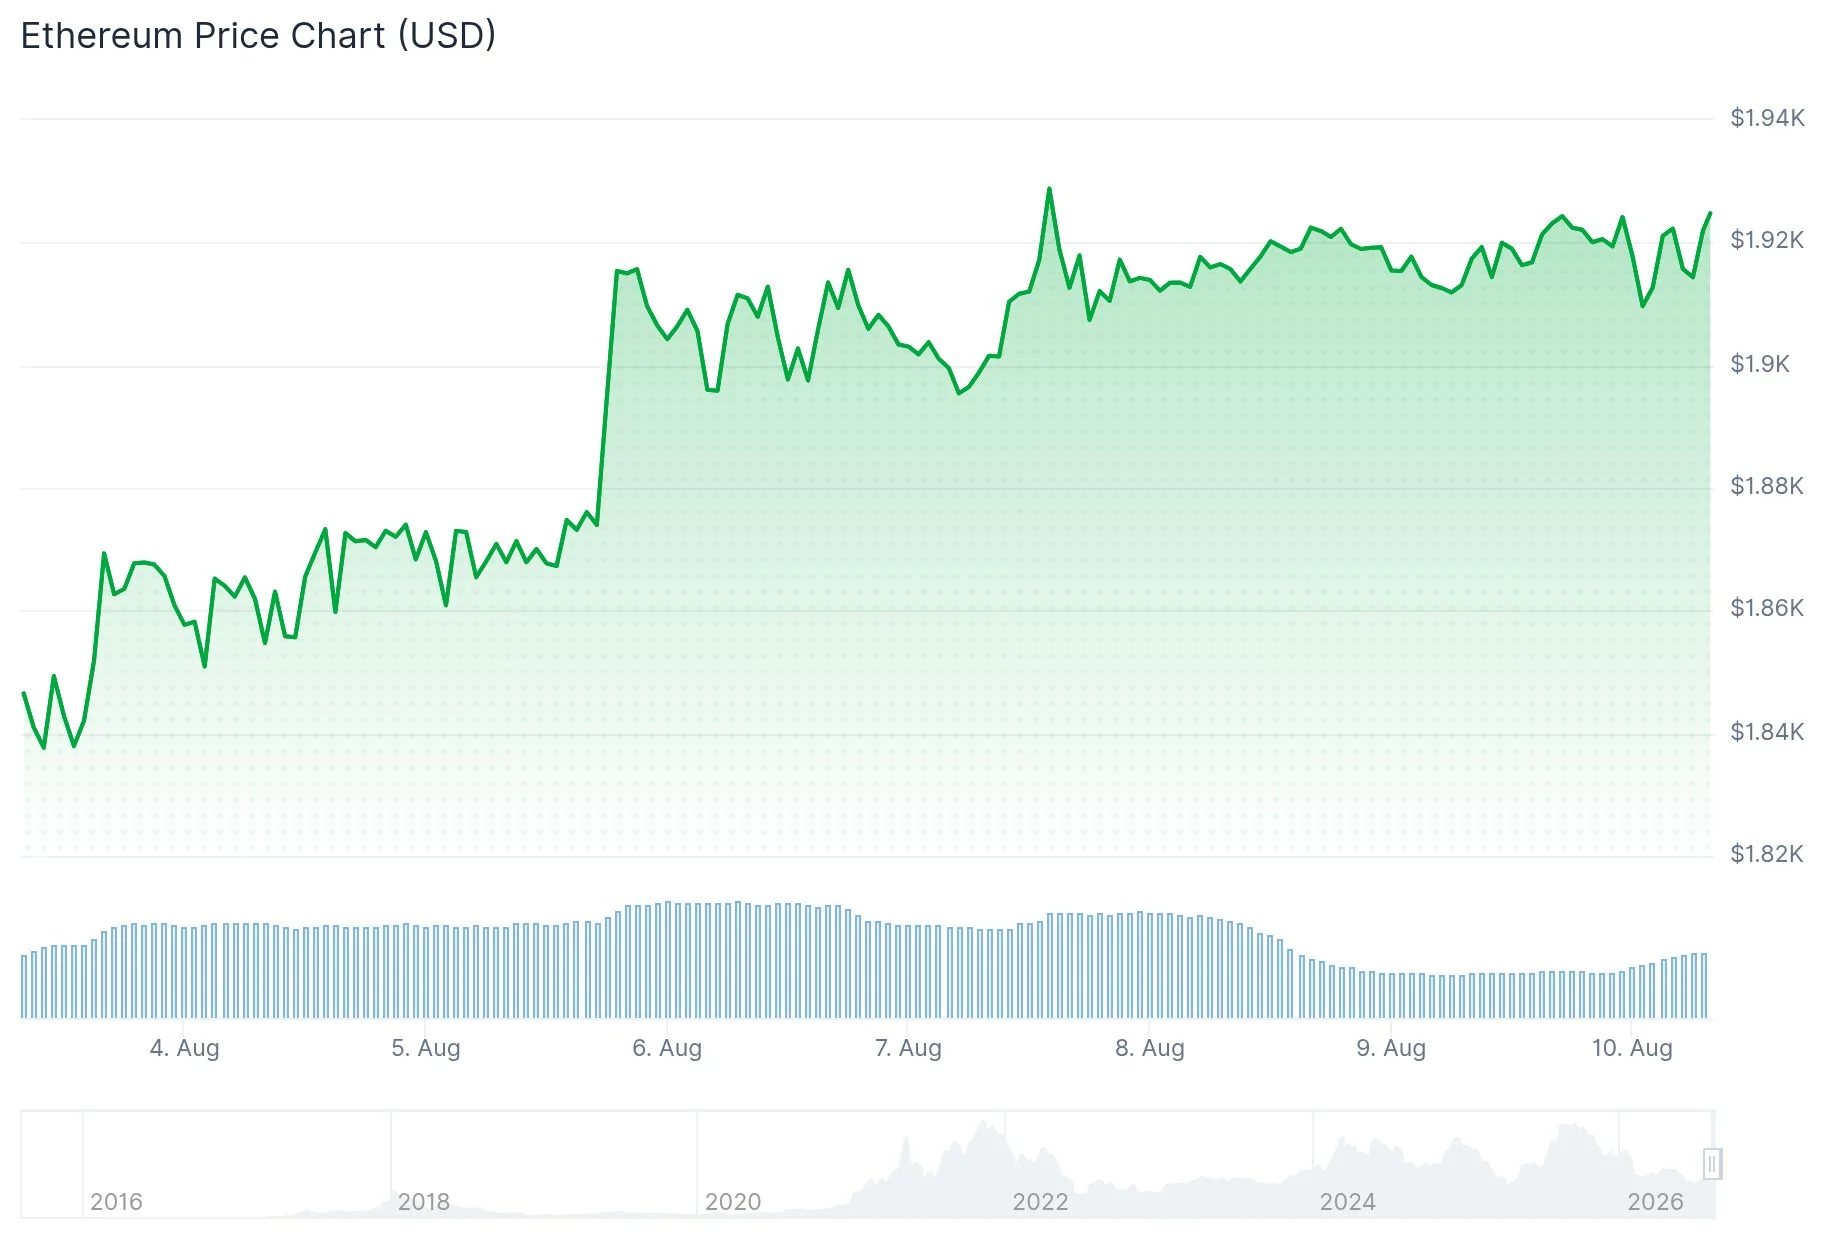 Ethereum (ETH) Price
Daily trading activity has reached $6.78 billion over the past 24 hours. With a market capitalization hovering around $231.76 billion, Ethereum represents roughly 10.49% of the entire cryptocurrency market valuation.
ETH’s monthly chart has generated two significant TD Sequential Buy indicators: specifically, a Black 9 and an S13 signal. Historically, these technical formations have coincided with major price inflection points for Ethereum.
Market analyst Ali Charts highlighted previous occurrences of these signals. In September 2022, a Black 9 buy signal preceded a substantial 236% upward movement. Similarly, an A13 buy signal recorded in April 2025 resulted in a 258% price surge. While historical patterns don’t ensure future outcomes, market participants are monitoring these developments with interest.
Market observer Ted (@TedPillows) emphasized that ETH continues to maintain support above the $1,900 threshold. According to his assessment, sustained defense of this price level should enable Ethereum to break through the $2,000 mark.
Ethereum has consistently protected the $1,800–$1,850 support range, with buying activity emerging whenever prices test this zone. This region continues to serve as the critical downside reference point.
$2,000 Barrier Represents Critical Breakout Zone
The price corridor between $1,980 and $2,000 has functioned as a significant obstacle throughout the current recovery phase. A decisive move above the $2,000 level would provide the strongest confirmation that upward momentum is accelerating.
Should Ethereum successfully breach this resistance, attention would shift to $2,100 as the subsequent objective. This target aligns closely with the 200-day exponential moving average, currently positioned around $2,124.
From a technical analysis perspective, ETH is trading above its 50-day EMA located at $1,864, though it remains constrained by the 100-day EMA positioned near $1,924. The Relative Strength Index currently reads approximately 56, indicating consistent momentum without entering overbought territory.
The MACD indicator continues to show a marginally negative reading, though gradual improvement suggests diminishing downside pressure.
Spot Ethereum ETF Demand Reaches Peak Levels
From an institutional investment perspective, spot Ethereum exchange-traded funds accumulated $244.94 million in net inflows during the previous week. This represents the strongest weekly performance observed in approximately four months.
Additionally, two cryptocurrency wallets purchased a combined 80,000 ETH, representing approximately $152 million in value during the past several days.
Should Ethereum fail to hold the $1,800 support area, the constructive technical setup would be compromised. The subsequent major support level beneath that zone is located at $1,385.
Ethereum is presently trading marginally below the 100-day EMA at $1,924, representing the immediate resistance level requiring attention in the near term.
The post Ethereum (ETH) Price Eyes $2,000 Breakthrough as Bullish Indicators Mount appeared first on Blockonomi.