Key Highlights ETH currently hovers around $2,617 following a dip beneath the $2,600 threshold Sepolia testnet successfully deployed the Glamsterdam upgrade this Tuesday Spot Ethereum ETFs ha
Key Highlights
- ETH currently hovers around $2,617 following a dip beneath the $2,600 threshold
- Sepolia testnet successfully deployed the Glamsterdam upgrade this Tuesday
- Spot Ethereum ETFs have experienced continuous outflows for six consecutive sessions, totaling $207 million
- More than $400 million worth of long positions faced liquidation in a 20-minute window
- Technical analysts suggest potential decline toward the $2,400–$2,600 zone before any rally to $3,400
Ethereum (ETH) is currently trading near $2,617 after experiencing a notable decline that pushed the cryptocurrency below the $2,600 level. This movement ended a relatively stagnant period where the asset remained confined within a narrow band between $2,650 and $2,750.
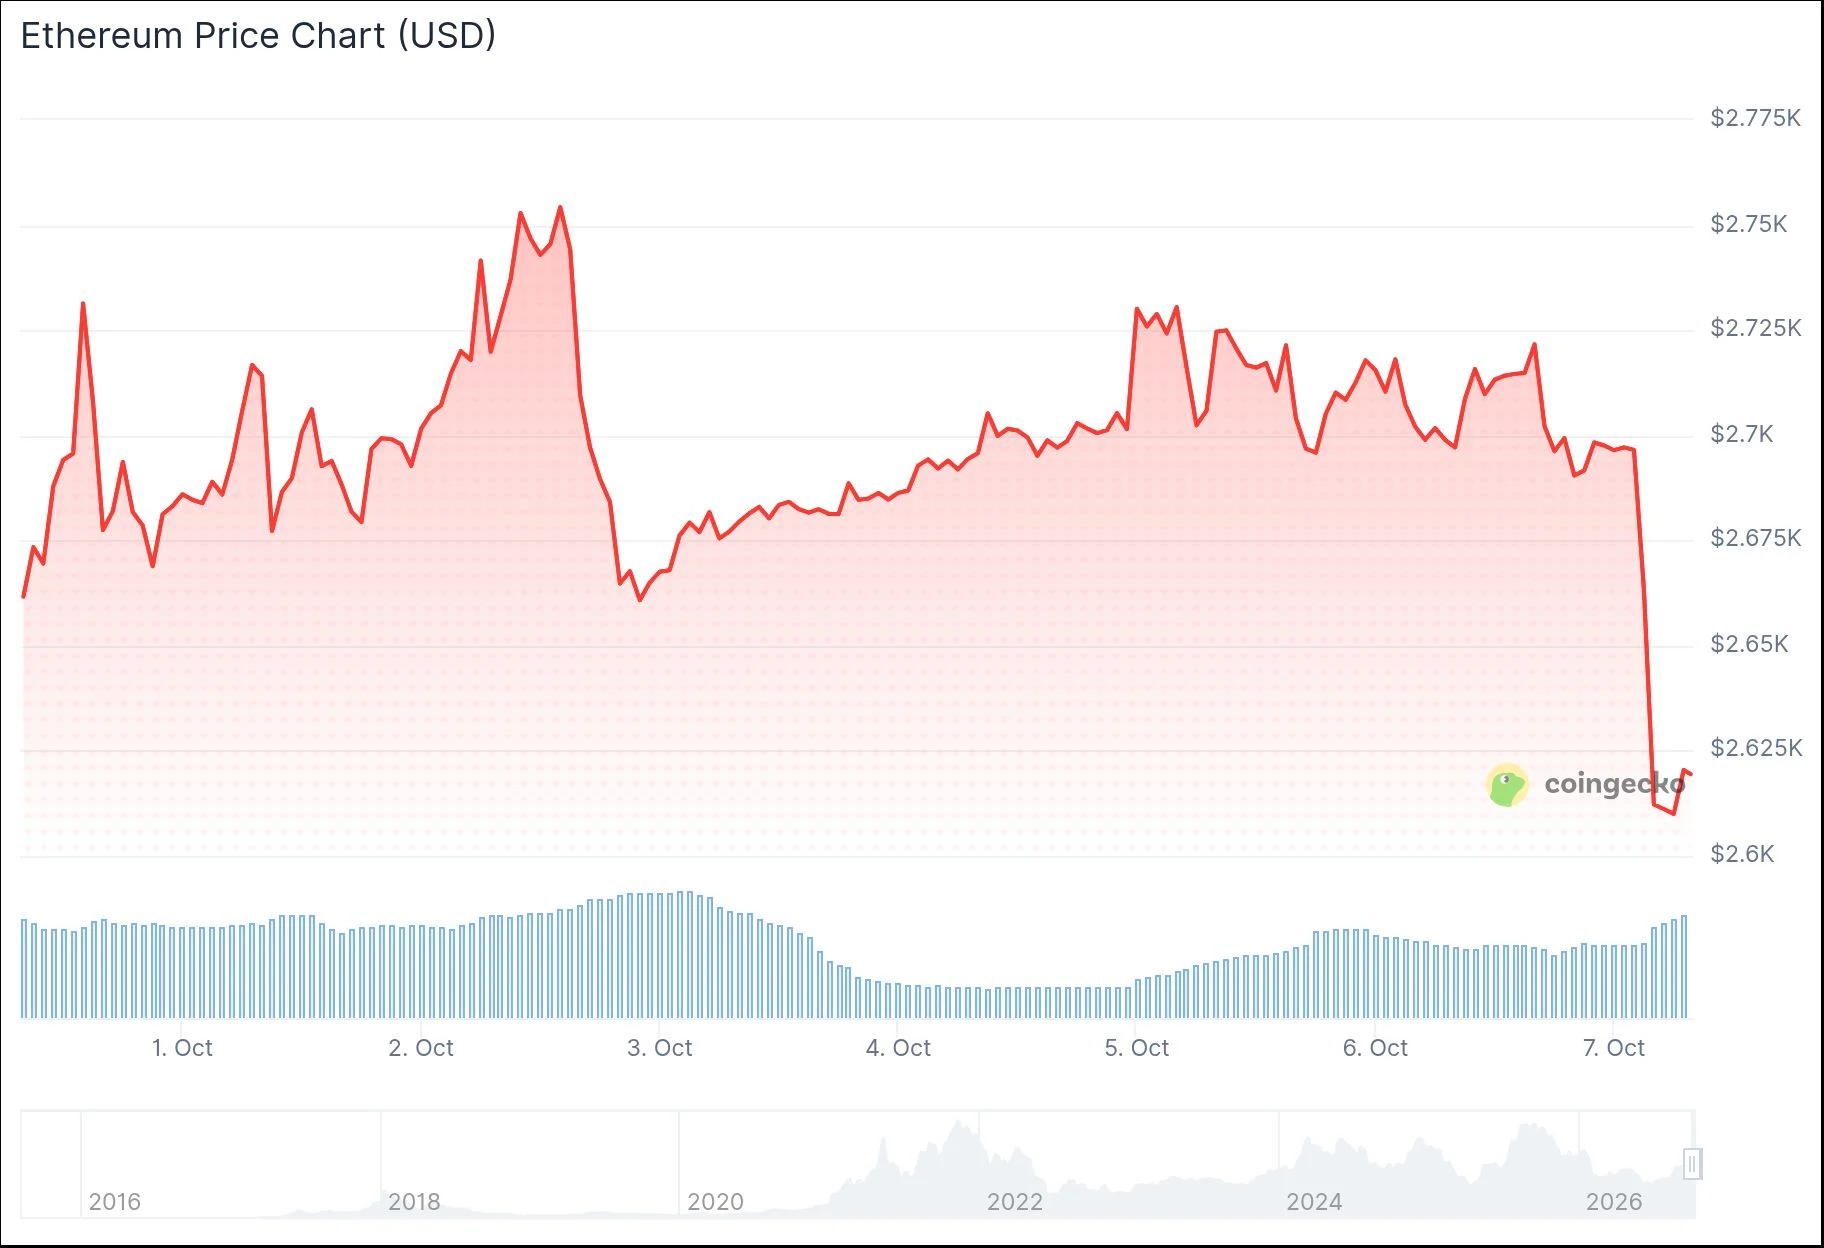 Ethereum (ETH) Price
The downward pressure coincided with Tuesday’s deployment of Ethereum’s Glamsterdam upgrade on the Sepolia testnet. This testnet launch represents a crucial milestone before the protocol enhancement reaches the main network.
The Glamsterdam release merges two distinct protocol improvements—Amsterdam and Gloas. The comprehensive package encompasses 18 primary Ethereum Improvement Proposals alongside 7 supplementary ones, introducing modifications to block processing and data management protocols.
Among the most significant alterations is the expansion of the gas limit ceiling, which increases from 60 million to 200 million units. This enhancement enables the network to accommodate substantially more transactions and execute more complex computational tasks within each block.
During Tuesday’s OKX NOW event, Ethereum co-founder Vitalik Buterin discussed the future landscape of blockchain applications. He projected that decentralized applications will increasingly integrate artificial intelligence capabilities throughout the coming two years, with automated systems managing a significant portion of user-facing interactions.
Market Volatility and Forced Liquidations
The sudden price correction sparked widespread forced closures throughout crypto markets. Market monitoring account Watcher.Guru reported that as ETH breached the $2,600 threshold, approximately $400 million in long cryptocurrency positions were forcibly closed within a mere 20-minute timeframe.
According to Coinglass tracking data, Ethereum liquidations reached $15.3 million across the past 24-hour period, with long position closures accounting for $10.5 million of that total. Technical chart analysis reveals ETH continues trading above its 20-day, 50-day, and 100-day moving averages, indicating persistent buying interest despite the recent downturn.
Key resistance zones appear at $2,781 initially, followed by stronger barriers at $3,075 and $3,260. Critical support areas include the 20-day moving average around $2,656, with additional floors at $2,631, $2,558, and the 50-day moving average positioned at $2,500.
Exchange-Traded Fund Withdrawals and Blockchain Metrics
Spot Ethereum exchange-traded funds have now registered their sixth consecutive session of negative net flows. Fund participants withdrew a cumulative $207 million during the five-day period, marking the most extended withdrawal sequence since June.
These outflows emerged after ETH’s ascent from $2,400 to $2,800 throughout late September. The withdrawal pattern indicates early investors are securing gains and reducing exposure.
Meanwhile, Ethereum’s Market Value to Realized Value (MVRV) Ratio increased from 1.4% to 3.5% during this timeframe. This fundamental indicator measures the relationship between current price and the average acquisition cost of all ETH holders, and it remains above neutral territory.
Market observers have drawn parallels between the current market structure and the April-May 2025 period, when ETH established a bottom around $1,400 before surging to fresh record highs following the Pectra protocol upgrade. They suggest history could repeat if the $2,400 support zone proves resilient.
The Relative Strength Index measurement for ETH remains positioned above the 50 threshold, signaling bullish momentum that may fuel an advance toward $3,400 should demand resurface. At 06:37 UTC on October 7, ETH was quoted at $2,617.71, representing a 2.98% intraday decline.
The post Ethereum (ETH) Slips Below $2,600 Amid Mass Liquidations and Six-Day ETF Outflow Streak appeared first on Blockonomi.

 Ethereum's Glamsterdam upgrade has gone live on the Sepolia testnet.
  7D NetFlow: +1,074