Ethereum is trading near $2,315, down 1.57% in 24 hours. The price is sitting just above the $2,300 support level while the wider crypto market cools. Traders are watching a rising trendline
Ethereum is trading near $2,315, down 1.57% in 24 hours. The price is sitting just above the $2,300 support level while the wider crypto market cools.
Traders are watching a rising trendline that has held since late June.
Crypto Market Slips After Fed Holds Rates at 3.75% to 4%
The US Federal Reserve left rates unchanged on October 28, 2026. The fed funds target range stays at 3.75% to 4%.
The Fed's tough tone a day earlier added pressure on risk assets.
Total crypto market cap fell 0.77% to $2.69 trillion. Bitcoin slipped below $80,000, while $ETH held above $2,300.
ETH Price Action Today: Key Market Data
Metric
Value
Price
$2,315.05
24h change
-1.57% (-$36.93)
Market cap
$282.48 billion
Futures volume (24h)
$40.01 billion
Spot volume (24h)
$1.92 billion
Circulating supply
122.17 million ETH
Futures trading is far larger than spot trading. That shows most of the action is in derivatives right now.
ETH Technical Analysis: Trendline Support Under Test
So far, yes. The daily Binance chart shows $ETH testing the $2,300 to $2,320 zone, where the rising line from early July meets the price.
Today's candle dipped to $2,293.44 and closed near $2,315.01, down 1.89%. ETH topped out near $2,800 in September before sliding.
The price now sits below the 20-day and 50-day EMAs. The RSI is at 34.92, under its signal line at 38.09. That points to weak momentum.
ETH Key Support and Resistance Levels to Watch
Level
Price
Role
200-day EMA
$2,319.56
Current test
100-day EMA
$2,361.77
First hurdle
20-day EMA
$2,414.85
Resistance
50-day EMA
$2,445.68
Resistance
Round number
$2,500
Resistance
Support zone
$2,280 to $2,250
Key floor
Lower support
$2,200
Next stop if floor breaks
A bounce could reach $2,360 to $2,415 first. A daily close under the trendline and the $2,280 to $2,250 zone would weaken the bullish case.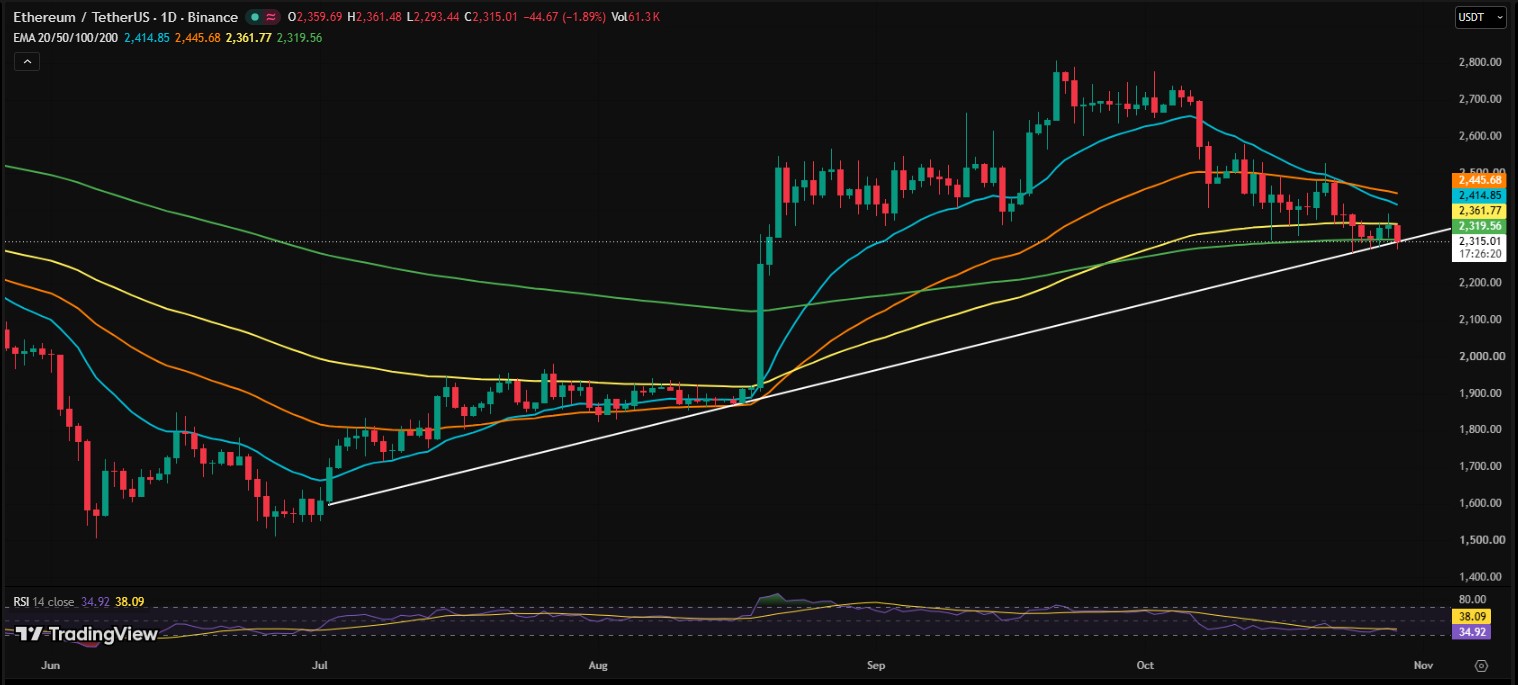
ETH ETF Flows Turn Negative as BlackRock Sees Outflows
As per SoSoValue, Spot ETH ETFs saw net outflows of $21.41 million on October 28. Cumulative net inflows still stand at $12.55 billion.
Total net assets are $14.27 billion, or 4.95% of ETH's market cap.
Fund
Sponsor
Daily flow
ETHA
BlackRock
-$44.83M
FETH
Fidelity
+$18.78M
ETH
Grayscale
+$3.62M
MSSE
Morgan Stanley
+$1.02M
BlackRock's ETHA led the outflows. Most other funds reported no flows. Short-term selling may be profit-taking or plain caution.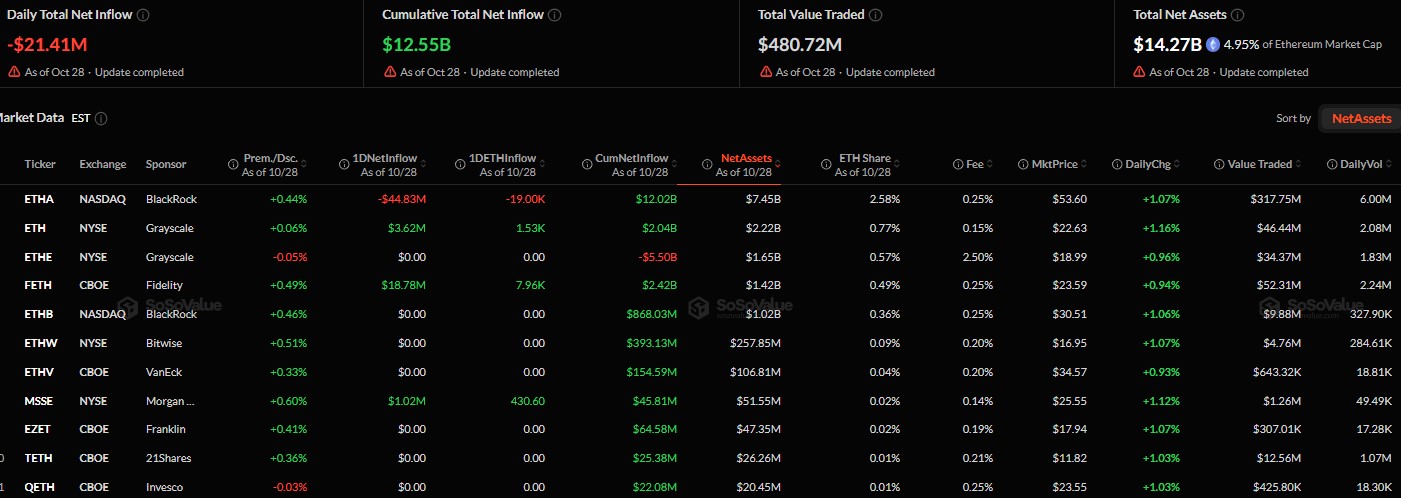
Derivatives Data: $80.34M Liquidated in 24 Hours
Open interest is $29.83 billion, down 0.78%. Options volume jumped 45.60% to $1.88 billion.
The overall long/short ratio is 0.9904, close to balanced. Binance accounts lean long at 3.4683, and OKX sits at 2.71. Top traders on Binance show 1.8945 by position.
Window
Total rekt
Longs
Shorts
1 hour
$699.72K
$695.70K
$4.02K
4 hours
$13.68M
$5.29M
$8.39M
12 hours
$57.20M
$29.46M
$27.74M
24 hours
$80.34M
$39.06M
$41.27M
Shorts lost slightly more over 24 hours. Longs took almost all of the latest hour.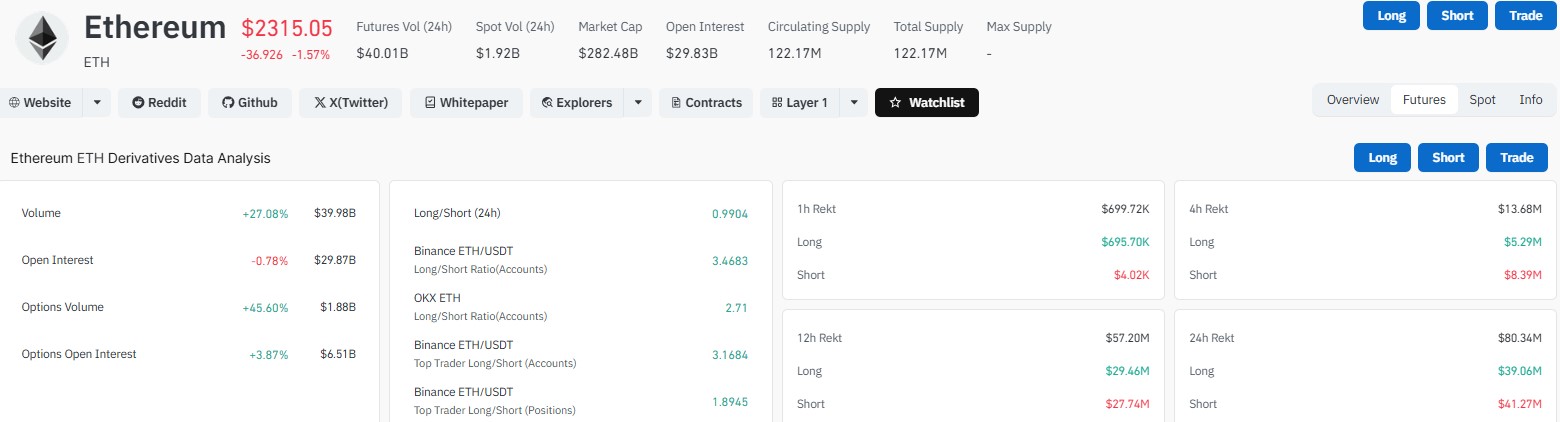
Analyst View: Javon Marks Eyes Rebound Toward $4,811
Analyst Javon Marks says ETH support is holding. He sees a recovery of over 102% toward $4,811.71 and the all-time highs.
He adds that a break above that level could extend toward $8,500 or more. That is a long-range view. The daily chart still has work to do first.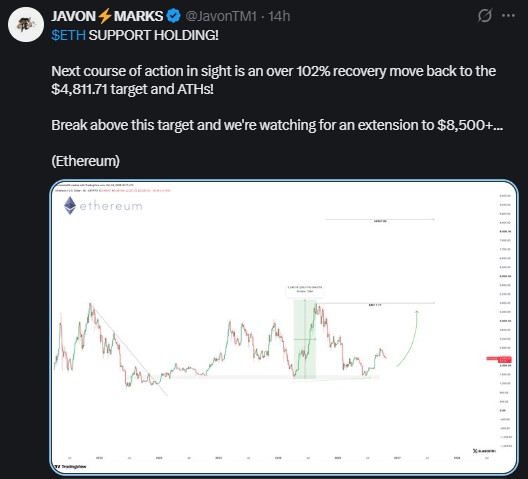
Ethereum Outlook: Relief Rally or Break Below $2,250?
Nobody knows. The trendline is intact, but momentum is soft, and the EMAs sit above the price.
A relief rally needs stronger volume and a move back over the EMA cluster. Losing $2,250 would shift focus to $2,200.
Disclaimer
This article is for information only and is not financial advice. Crypto assets are volatile, and you can lose money. Do your own research and speak with a licensed advisor before making any investment decision.