Key Takeaways Santiment recorded 2.05 bullish ETH comments for every bearish comment, compared with 0.82 for Bitcoin. CryptoQuant found ETH’s Binance Estimated Leverage Ratio near 0.69, above
Key Takeaways
- Santiment recorded 2.05 bullish ETH comments for every bearish comment, compared with 0.82 for Bitcoin.
- CryptoQuant found ETH’s Binance Estimated Leverage Ratio near 0.69, above its 100-period moving average.
- Bitcoin’s ratio was near 0.19 and had moderated from higher readings earlier in 2026.
ETH and BTC are sending opposite messages
Santiment’s latest social-data update found 2.05 bullish Ethereum comments for every bearish one across X, Reddit and Telegram. The firm characterised the discussion around ETH as FOMO-driven, following its rebound and renewed attention on staking and future network upgrades.
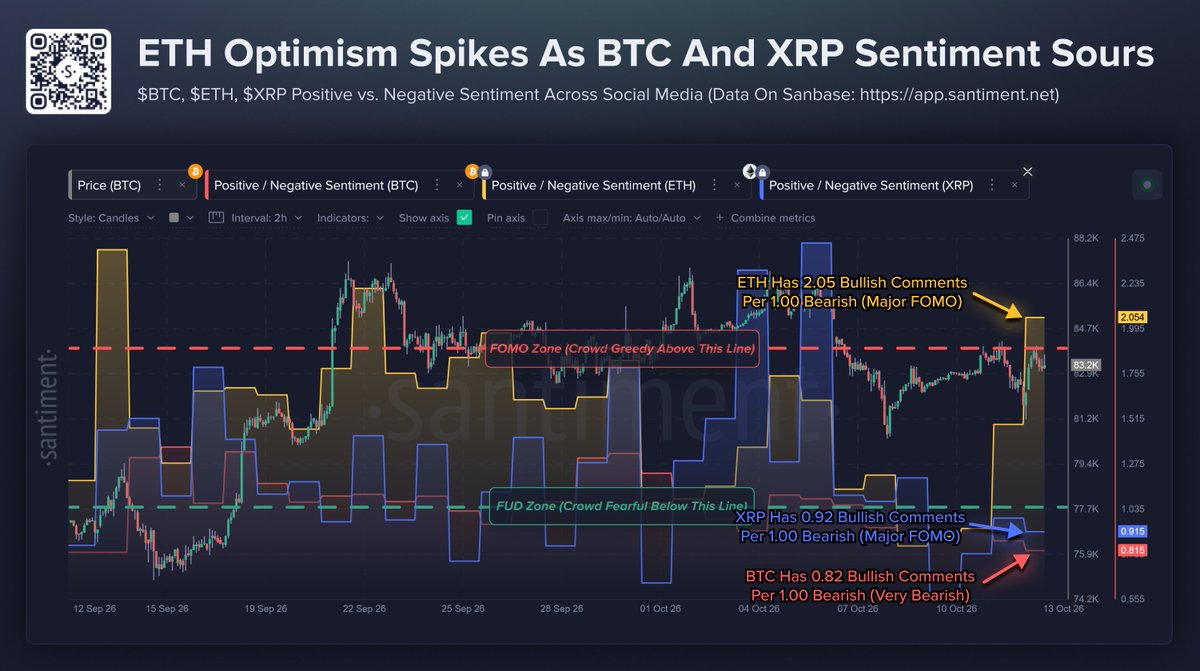
Ethereum sentiment turns strongly bullish.
Bitcoin produced the opposite reading: 0.82 bullish comments for every bearish comment. Santiment linked the weaker mood to Bitcoin’s rejection near $87,000, its slide toward $81,000 and the wider pressure on risk assets during the sell-off.
Neither figure says where either asset goes next. Social data measures the balance of public discussion, not the amount of capital committed to a trade. Its value here is that it shows where confidence has concentrated: ETH traders are discussing a rebound, while BTC traders remain more defensive.
Signal
Ethereum
Bitcoin
Social mood
2.05 bullish comments for every bearish comment
0.82 bullish comments for every bearish comment
Binance leverage trend
Ratio near 0.69 and still above its 100-period moving average
Ratio near 0.19 after moderating from earlier 2026 readings
What this does not show
Whether traders are mainly long or short, how deep order-book liquidity is, or the direction of the next price move.
Leverage ratio is a sensitivity measure, not a long-or-short signal
The difference becomes more useful when placed beside derivatives positioning. CryptoQuant’s Estimated Leverage Ratio compares open interest with the amount of an asset held in an exchange’s reserves. It offers a way to track how large the derivatives market has become relative to the coins available on that exchange.
A higher ratio can result from rising open interest, falling exchange reserves, or both. It does not reveal whether the market is positioned for a long squeeze or a short squeeze, and it cannot measure actual order-book depth. It should therefore be read as a sign of potential derivatives sensitivity rather than a stand-alone trading signal.
The metric is also most useful against each asset’s own history. ETH and BTC have different reserve patterns, derivatives markets and custody flows, so a 0.69 ETH reading is not a simple numerical verdict over a 0.19 BTC reading. The meaningful comparison is the recent direction of each ratio.
How to read the two datasets together
Sentiment shows where conviction is building; leverage shows whether derivatives exposure is remaining elevated around that conviction. A stronger risk warning would require further evidence, such as rising open interest and increasingly positive funding – not social optimism alone.
Ethereum’s leverage ratio has rebuilt after earlier resets
CryptoQuant analyst MorenoDV_ placed Ethereum’s Estimated Leverage Ratio on Binance near 0.69 while ETH traded around $2,400. The analysis compared that with readings near 0.53–0.55 before the October 10, 2025 liquidation event.
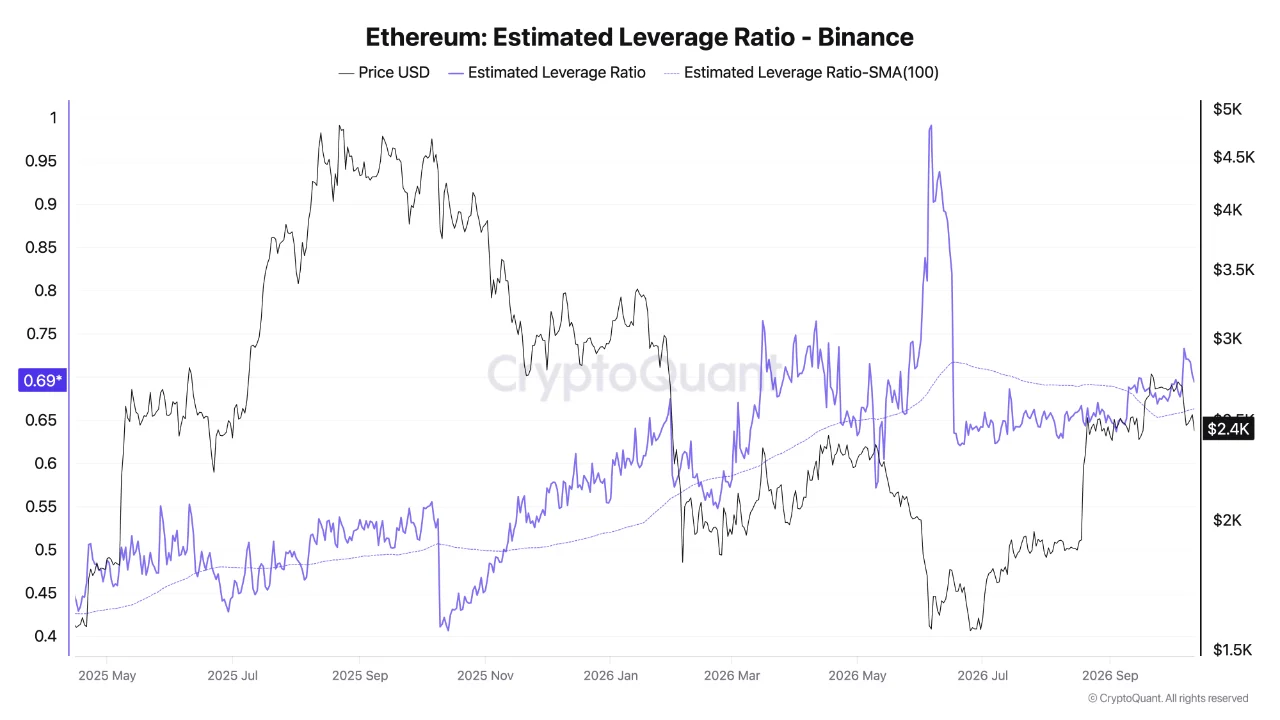
Ethereum chart showing Binance estimated
leverage ratio near 0.69.
More important than the single reading is what followed. CryptoQuant’s chart showed the ratio rebuilding after sharp resets and remaining above its 100-period moving average. In other words, ETH’s derivatives exposure relative to Binance reserves has stayed in a higher range even after prior bouts of deleveraging.
That does not prove that ETH is about to decline, and it does not establish that leveraged longs dominate the market. It does mean that a fresh rise in open interest and positive funding would deserve closer attention: traders would be adding exposure while the ratio is already elevated against ETH’s recent trend.
Bitcoin’s crowd is cautious while its leverage trend has cooled
Bitcoin’s social reading is weaker, but CryptoQuant’s Binance data shows a less persistent leverage setup. Its Estimated Leverage Ratio stood near 0.19—around the level seen before the October 2025 liquidation event cited in the analysis—and had fallen from higher readings earlier in 2026.
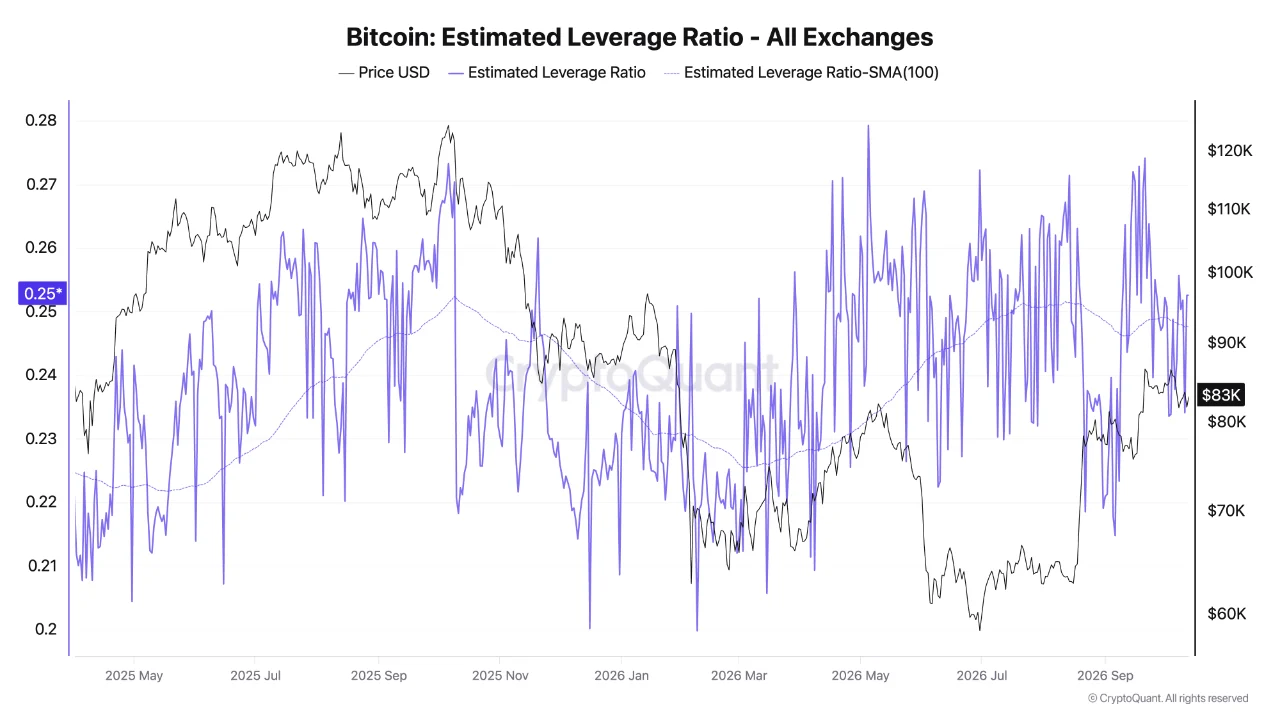
Bitcoin leverage remains relatively restrained.
The ratio was also below a declining moving average in CryptoQuant’s chart. That suggests that derivatives exposure relative to Binance reserves has been easing rather than rebuilding in the same way described for ETH.
This does not make Bitcoin automatically bullish or safer. A lower ratio can reflect healthier deleveraging, but it can also occur in a weak market with little appetite to add new futures positions. Bitcoin still needs price stability and renewed spot demand before a lower leverage reading can support a stronger recovery case.
What would confirm or weaken the current divergence?
Asset
Current mix
What would strengthen the reading
What would weaken it
ETH
Bullish social discussion and an elevated Binance leverage trend
Open interest rises, funding stays strongly positive and the leverage ratio remains elevated
Open interest and the ratio decline while ETH holds or extends its recovery
BTC
Fearful social reading and a cooling Binance leverage trend
Price stabilises and spot demand improves without a sharp return in
leverage
A weak bounce attracts a fast rebuild in open interest and leverage
The supplied sentiment and leverage datasets do not include live funding-rate or open-interest changes. Those are the next figures that would test whether ETH’s social optimism is becoming a crowded derivatives trade, or whether Bitcoin’s lower leverage is accompanied by genuine buying demand.
ETH and BTC need different confirmation before the next move
Ethereum currently has the stronger narrative, but its Binance leverage ratio has not reset as fully as Bitcoin’s. That makes the next derivatives data important: rising open interest and positive funding would make ETH’s rebound more vulnerable to a rapid reversal, while a calmer build in exposure would weaken that concern.
Bitcoin’s cautious sentiment should not be read as a bullish signal on its own. Its leverage trend has improved, but the market still needs spot demand and price stability to show that the sell-off has produced a durable base rather than simply reduced speculative participation.
This article is provided for informational purposes only and does not constitute financial or investment advice. Social sentiment and derivatives metrics are interpretive tools, not guarantees of future price movement.
The post Ethereum FOMO Meets Higher Binance Leverage Than Bitcoin appeared first on Coindoo.