What to Know Ethereum trades near $2,500 as an emerging golden cross strengthens its medium-term structure following August’s substantial recovery from $1,900 levels. ETH faces resistance bet
What to Know
- Ethereum trades near $2,500 as an emerging golden cross strengthens its medium-term structure following August’s substantial recovery from $1,900 levels.
- ETH faces resistance between $2,500 and $2,550 while its RSI near 76 signals stretched buying conditions that traders should monitor.
- Support levels at $2,400 and $2,150 may determine whether Ethereum preserves its recovery or enters a deeper market correction phase.
Ethereum is approaching a potential golden cross as ETH trades near $2,500 and challenges resistance between $2,500 and $2,550. However, weaker momentum and an overbought relative strength index could limit the technical signal’s effect on Ethereum’s next movement.
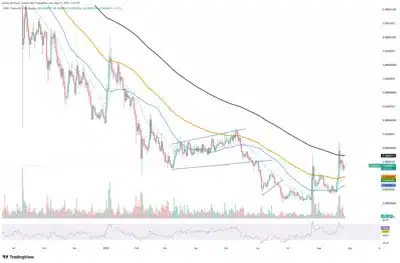
ETH climbed from the $1,900 region during August and reclaimed several moving averages throughout its recovery. Furthermore, the cryptocurrency crossed its long-term trend line near $2,150, which had restricted advances for several months.
ETH currently trades approximately 16% above these averages, reflecting its rapid advance from the previous consolidation range. A golden cross develops when a shorter-term moving average crosses above a longer-term average during a sustained recovery.
Nevertheless, the indicator confirms existing momentum rather than identifying the beginning of a price rally. Ethereum had already gained approximately $600 before the crossover approached completion, reducing its value as an early signal.
Also Read; SEC Clears Evernorth XRP Treasury Merger Registration
Overbought RSI and Resistance Threaten Ethereum’s Breakout
Ethereum’s relative strength index stands near 76, placing the cryptocurrency within the indicator’s overbought territory. Although this reading does not guarantee an immediate correction, it shows that buying pressure may appear stretched.
Meanwhile, ETH has struggled to move decisively above the resistance area between $2,500 and $2,550. A confirmed breakout above $2,550 could strengthen the recovery and create a possible route toward $2,600.
Moreover, sustained demand beyond that price could allow Ethereum to test the resistance region near $2,700. However, another rejection near $2,550 could encourage traders to secure profits following Ethereum’s extended advance.
Source: Tradingview
The $2,400 level provides the nearest area where buyers could absorb selling pressure during a moderate retreat. A deeper correction could bring ETH toward the support range between $2,200 and $2,150.
Significantly, Ethereum’s long-term moving average sits around that region and could provide dynamic support during increased volatility. Conversely, losing the long-term average could undermine the bullish crossover and expose ETH to additional selling pressure. Ultimately, price behavior around $2,550 and $2,150 will determine whether Ethereum establishes a durable recovery or enters a broader correction.
Also Read; UAE Security Adviser Takes Major Stake in Trump Family’s Banking Venture
The post Ethereum Golden Cross Nears as $2,550 Resistance Tests Rally Strength appeared first on 36Crypto.