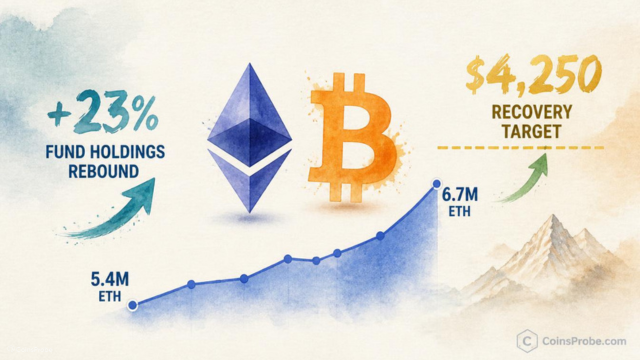
Key Highlights ETH fund holdings rose from about 5.45M to 6.70–6.77M ETH, up 23–24% since July. Price on the chart is $2,680. That rebound is approaching the October 2025 holdings peak, not c
Key Highlights
ETH fund holdings rose from about 5.45M to 6.70–6.77M ETH, up 23–24% since July. Price on the chart is $2,680.
That rebound is approaching the October 2025 holdings peak, not confirmed through it. A reclaim would strengthen the thesis.
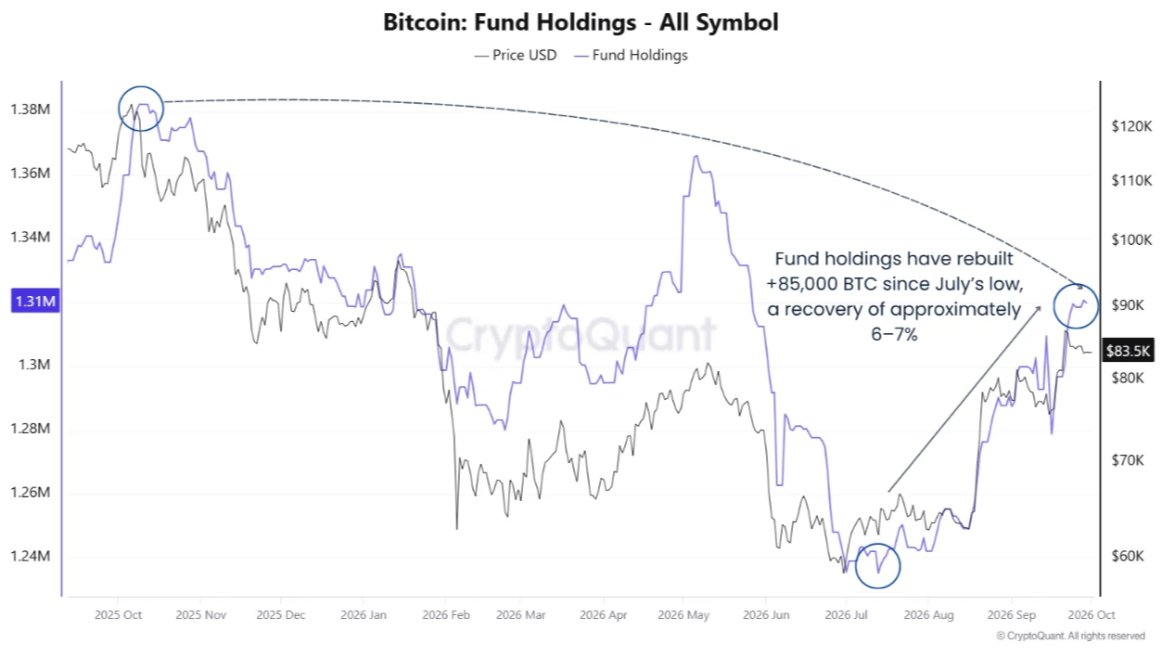
BTC fund holdings rose from about 1.235M to 1.31–1.32M BTC, up 6–7%, and remain below the October peak and the May high. Price on the chart is $83,500.
Both are rising. The note does not call it a rotation out of Bitcoin. The risk it names is renewed redemptions.
Ethereum is leading institutional recovery across crypto fund exposure — with fund holdings rebounding 23–24% from their July 2026 lows even as the full recovery thesis remains one key confirmation away. At the time of writing, Bitcoin is trading at approximately $85,990, up 2.05% in the past 24 hours, with a market cap of $1.73 trillion. Ethereum’s price has already moved from roughly $1,500 to $2,680 — a completed +79% recovery — but the structural signal that would validate the next leg is still pending.
The analysis comes from CryptoQuant contributor @MorenoDV_, published via the official @cryptoquant_com channel. His exact conclusion: “A reclaim of previous holdings highs would strengthen the recovery thesis.” That is not a hedged observation — it is a precise, testable condition tied to a specific on-chain metric: whether institutional fund holdings of ETH break back above the 6.7M ETH threshold they occupied before the cycle turned lower.
The chart shared by @cryptoquant_com tracks Ethereum fund holdings against price from September 2025 through October 2026. The data tells a two-part story: recovery already underway, but the defining confirmation not yet delivered.
Fund holdings bottomed alongside price in July 2026, at approximately 5.4M ETH. Since then, institutional positions have rebuilt to roughly 6.7M ETH — a gain of 23–24% in holdings volume. Price tracked that accumulation almost exactly, rising from $1,500 to the current $2,680. The correlation is not coincidental. When funds add ETH at this scale, they are expressing directional conviction through regulated, reportable vehicles — not speculative spot buying.
The remaining question is what happens above 6.7M ETH. That level corresponds to the prior holdings highs — the peak institutional exposure before the decline. @MorenoDV_ identifies this as the defining threshold. A confirmed break above it would signal that institutions have not merely recovered their positions but have moved into net-new accumulation territory. The resistance zone on price that maps to that holdings level sits between $4,250 and $4,750 — approximately +59% from current levels. The descending resistance trendline from the October 2025 peak runs directly through that zone.

Chart 1 of 2: Ethereum Fund Holdings Analysis | Source: @cryptoquant_com (X)
Failure to break that trendline introduces a different risk: a double-top structure in both price and holdings, where the second approach to prior highs produces rejection rather than breakout. That outcome would not invalidate the recovery entirely but would reset the timeline materially.
The second chart in @MorenoDV_’s analysis covers Bitcoin fund holdings across the same October 2025 to October 2026 window. The structure is different from Ethereum — and importantly, the confirmation level is closer.
Bitcoin fund holdings bottomed at approximately 1.235M BTC in July 2026, alongside price near $60,000. Since then, institutional positions have rebuilt by roughly 85,000 BTC — a 6–7% increase — bringing total fund holdings to approximately 1.31M BTC. Price has recovered from $60,000 to $83,500 in parallel, a completed +39% move. The pattern mirrors Ethereum’s recovery structure but at a more compressed scale.
Source: @cryptoquant_com (X)
The critical level for Bitcoin’s recovery thesis is $90,000. That price corresponds to the recent cycle high marked on the chart and sits just 8% above current levels. A sustained close above $90,000 would confirm that institutional accumulation has translated into a full recovery from the July low — not merely a retracement bounce. Failure to reclaim $90,000 risks a retest of the $75,000–$80,000 support zone, which has defined the lower bound of the recovery range. A bearish macro arc overlaid on the chart by @MorenoDV_ warns that longer-term structural headwinds remain even if the short-term picture is constructive. This aligns with earlier analysis tracking institutional flows into Ethereum as BlackRock moved toward a spot ETF — a dynamic that predated and potentially seeded this current fund holdings recovery.
Fund holdings data — tracked via regulated investment vehicles — measure institutional conviction in a way that spot price cannot. Price reflects all market participants simultaneously: retail, algorithmic, leveraged. Fund holdings isolate a single cohort: institutions operating through reportable, custody-held structures that cannot easily unwind intraday.
When fund holdings rise +23% in ETH while price rises +79%, the holdings increase is the leading structural signal. It represents deliberate, sustained accumulation — not momentum chasing. The same logic applies to Bitcoin’s 85,000 BTC rebuild. That volume moved into custody over months, not hours. It does not reverse on a single bad week.
The two-signal picture @MorenoDV_ presents is therefore asymmetric in its information value. Both ETH and BTC fund holdings have already confirmed the recovery phase is real. The open question — for both assets — is whether the next phase, a breakout to new holdings highs, follows. For Ethereum, that requires breaking above 6.7M ETH in fund holdings and $4,250–$4,750 in price. For Bitcoin, it requires a sustained close above $90,000.
Bullish Scenario — ETH Holdings Break Above 6.7M, BTC Reclaims $90K
If Ethereum fund holdings confirm a breakout above the 6.7M ETH prior high, the recovery thesis transitions from rebound to structural resumption. Price resistance at $4,250–$4,750 becomes the next test — approximately +59% from current $2,680. For Bitcoin, a sustained monthly close above $90,000 would invalidate the bearish macro arc and open the path toward prior highs near $120,000, representing roughly +40% from current levels.
Bearish Scenario — Double-Top in Holdings, $90K Fails
If Ethereum fund holdings stall at the 6.7M ETH level and price fails to break the descending resistance trendline at $4,250, a double-top structure forms — and the recovery narrative weakens. For Bitcoin, failure to break $90,000 with conviction risks a pullback to the $75,000–$80,000 support zone. The bearish macro arc on the BTC chart would then reassert structural dominance over the short-term recovery signal.
The on-chain picture from CryptoQuant via @MorenoDV_ is precise: institutional fund exposure to both ETH and BTC has already staged a confirmed recovery from July lows, with ETH leading in both percentage terms (+23% in holdings, +79% in price) and in the remaining distance to prior highs (+59% to $4,250–$4,750). Bitcoin’s remaining upside to its key level is narrower — just 8% to $90,000 — but the macro arc warns against assuming that proximity guarantees a clean break. Watch $90,000 on Bitcoin as the nearest binary — a sustained close above it confirms institutional recovery is complete. Watch the 6.7M ETH holdings threshold and the $4,250 price level on Ethereum as the test that determines whether this recovery becomes a new cycle or remains a retracement.
Disclaimer: The views and analysis presented in this article are for informational purposes only and reflect the author’s perspective, not financial advice. Technical patterns and indicators discussed are subject to market volatility and may or may not yield anticipated results. Investors are advised to exercise caution, conduct independent research, and make decisions aligned with their individual risk tolerance.
Also Read: SUI Daily Transactions Doubles in 30 Days as Stair-Step Pattern Targets $1.60