Key Takeaways ETH has tightened into a four-hour range. The $2,550 high remains the key resistance. Rising support is holding near current prices. RSI has formed a hidden bullish divergence.
Key Takeaways
- ETH has tightened into a four-hour range.
- The $2,550 high remains the key resistance.
- Rising support is holding near current prices.
- RSI has formed a hidden bullish divergence.
- A four-hour close will provide the clearest signal.
A pause below the recent high
ETH rallied from roughly $1,900 to the $2,550 area before the pace slowed. Since then, the four-hour chart has formed a narrowing range. Recent rebounds have met a descending resistance line, and each pullback has stopped at a higher level than the previous one.
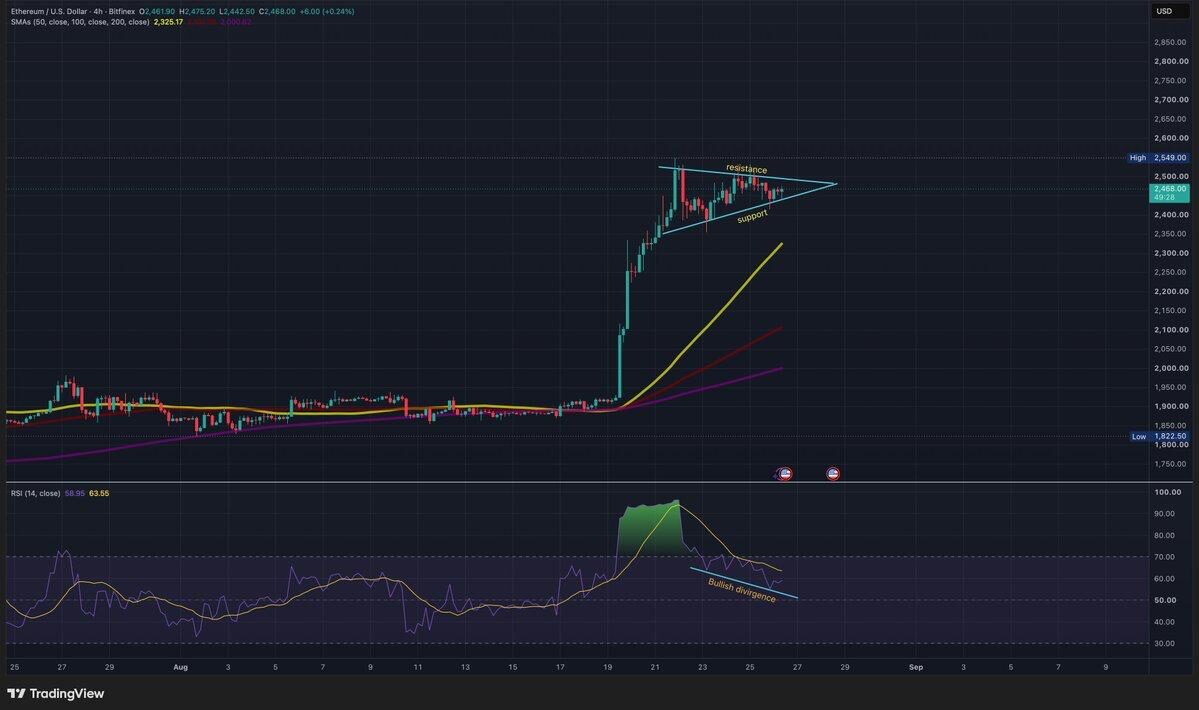
Ethereum price consolidates below resistance as bullish divergence forms on the 4-hour chart.
The formation resembles a pennant-style consolidation, though the label should remain secondary to the price levels. A few more candles can change the shape of the range. The important question is whether ETH can close outside it and maintain that position.
ETH traded close to $2,470 at the time of writing while the descending boundary stood around $2,490-$2,510. This is a dynamic level that moves lower as the range develops. Above it sits the August swing high near $2,550.
Resistance, support and the 50-period average
A four-hour close above the descending trendline would show that buyers have regained control of the immediate range. A return to that line after the break would offer the next test. Price holding above it would give the move more weight. A quick move back into the range would show that sellers remain active.
The rising support line sits in the mid-$2,400s on the chart and moves higher with every new candle. ETH needs to stay above this line to preserve the current pattern. A close below it would shift attention to the $2,400 area.
The 50-period simple moving average sits near $2,325. ETH remains above that average, which keeps the four-hour trend pointed higher. A move toward it would mark a larger pullback from the current range and should be treated accordingly.
RSI adds a secondary signal
ETH has held a series of higher lows. Over the same period, RSI has made lower lows. That combination is known as a hidden bullish divergence and can appear during an uptrend that is taking a pause.
The signal supports the continuation case, but it cannot establish a price target or confirm a breakout by itself. RSI has also cooled from the high reached during the initial rally. Price and volume need to carry the greater weight in the analysis.
READ MORE:
 Revolut Launches EURR: What Its Euro Stablecoin Means for Users
What would change the short-term view
- A bullish confirmation: ETH closes above the upper trendline on the four-hour chart and holds that area during a retest. The $2,549 swing high would then become the next resistance level.
- A bearish warning: ETH closes below rising support and cannot recover it. The $2,400 zone would become the first nearby level to watch. The 50-period SMA near $2,325 would matter if selling continues.
- A weak breakout: ETH moves above resistance with little volume and quickly returns inside the range. That sequence would show that the first break failed to attract sustained buying.
A chart level is not an automatic entry
The four-hour range offers useful reference points, though it does not determine the outcome. Bitcoin’s direction, broader market liquidity and sudden liquidation activity can all affect ETH quickly.
A breakout level is an observation point, not an automatic entry signal. Anyone trading with leverage should decide in advance how much they can lose if the move fails. Short-term volatility inside this range can be enough to trigger liquidation on heavily leveraged positions.
This technical analysis is provided for informational purposes only and does not constitute investment advice. Cryptocurrency markets are volatile, and readers should conduct their own research and consider their financial circumstances before making a trading decision.
The post Ethereum Nears a Decision Point as Its 4H Range Tightens appeared first on Coindoo.