Ethereum just had one of its strongest weeks in months. The Ethereum price today sits near $2,362.83, up 5.2% in the last 24 hours alone. Over the past three days, ETH price is up about 25%,
Ethereum just had one of its strongest weeks in months. The Ethereum price today sits near $2,362.83, up 5.2% in the last 24 hours alone.
Over the past three days, ETH price is up about 25%, and over the past week it has jumped about 26%, breaking out of a long consolidation zone above the $1,950 to $2,000 range.
This move did not come out of nowhere. A mix of short squeezes, falling exchange reserves, and a shift in whale behavior all lined up around the same time.
Below is a full breakdown of the data behind the move, plus where ETH price could be headed next.
Why Is Ethereum Going Up Today?
The short answer is short liquidations. Traders betting against ETH got squeezed hard.
In just the last 24 hours, total ETH liquidations hit $210.63 million. Of that, $159.66 million came from short positions, while longs only lost $50.97 million.
The pattern holds across shorter windows too:
Timeframe
Total Liquidations
Long Liquidations
Short Liquidations
1 hour
$4.47M
$1.17M
$3.29M
4 hours
$7.64M
$2.45M
$5.19M
12 hours
$62.56M
$11.26M
$51.30M
24 hours
$210.63M
$50.97M
$159.66M
Short traders have been taking the bigger hit in every window. That tells a simple story. A lot of people were betting ETH would fall, and instead it ripped higher, forcing them to close positions and buy back in.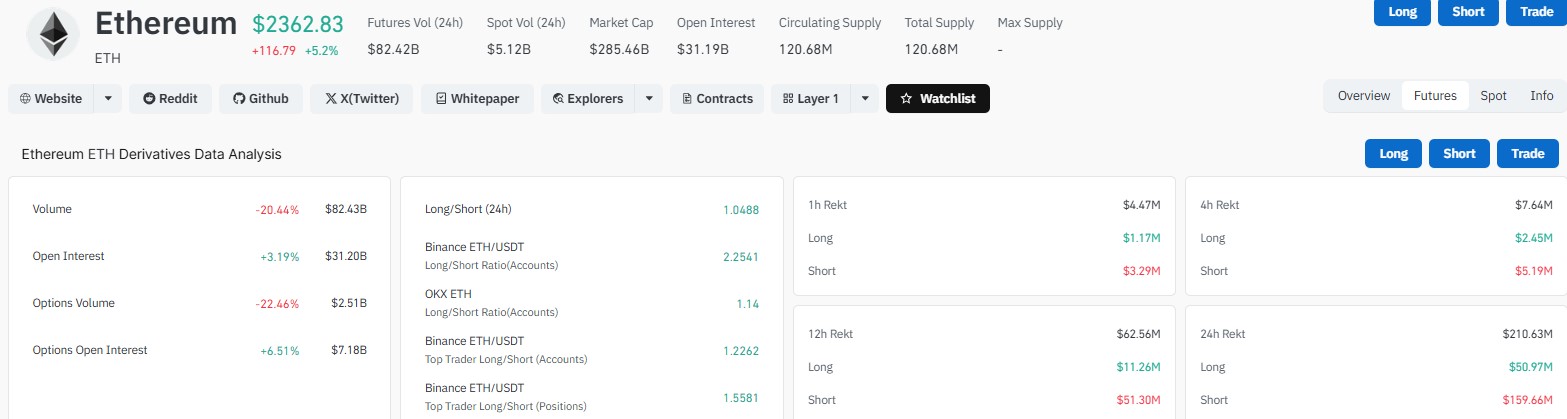
Ethereum News Today: What's Driving the Rally
A few things happened close together that pushed Ethereum price up.
Crowd sentiment flipped from a low point.Santiment data shows crowd sentiment on ETH hit a three-month low on August 17. Just two days later, ETH was up about 17%.
Weighted sentiment over a 7-day average had turned negative right before the bounce, which often lines up with a local bottom rather than a top.
Whale dump activity spiked once, then faded. A whale dump anomaly fired on August 18 at around $7.55 million. That is much smaller than the five similar events seen in each of the two prior weeks, suggesting large holders were not dumping aggressively into the move.
Exchange supply kept falling. ETH held on exchanges dropped to about 6.54 million coins on August 18, the lowest point of the stretch, down from around 7.07 million earlier in the period. Less supply sitting on exchanges usually means less immediate sell pressure.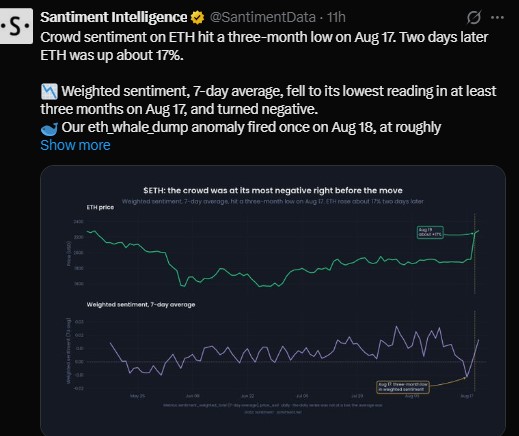
Macro tailwinds helped too. The US Treasury expanded long-end bond buybacks, which triggered a wave of short liquidations across crypto.
Bitcoin price today also rose about 7% on the same day, pulling the wider market higher. Total crypto market cap climbed 6.73% to $2.53 trillion, based on CoinMarketCap data.
Why Has Ethereum Suddenly Surged: The Whale Angle
Ethereum's largest wallets have actually been shrinking for three months, not growing.
Santiment data shows wallets holding more than 1,000 ETH shed roughly 1.7 million coins between May 20 and August 20, about 2.9% of that entire tier.
At the same time, the 1 to 10 ETH tier gained ground, rising from 4.38% to 4.52% of total supply, climbing on 65 days versus only 27 down days.
Only about 300,000 of those coins can be traced into smaller wallets. That means most of the outflow likely landed in staking contracts or bridge and exchange infrastructure rather than being sold outright.
The top tier includes exchange, bridge, and staking addresses alongside individual whales, so this shrinkage does not automatically mean whales are exiting ETH.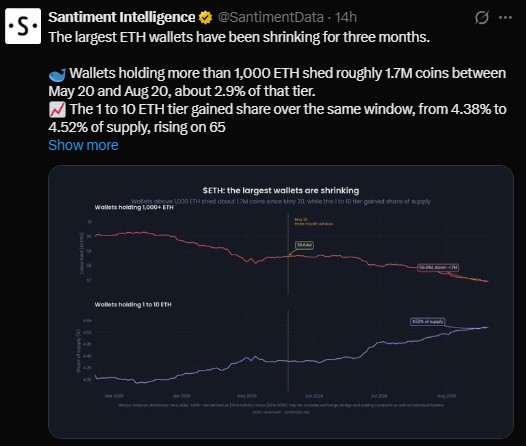
Ethereum ETF and Derivatives Data
Spot Ethereum ETFs recorded net inflows of $220.77 million, extending a four-day streak of positive flows. That is a sign institutional demand has not slowed down during this move.
On the derivatives side, futures volume over 24 hours stands at $82.42 billion, while spot volume is $5.12 billion. Ethereum's market cap sits around $285.46 billion, with open interest at $31.19 billion. Long/short ratios are above 1, pointing to a generally bullish positioning among traders right now.
Ethereum Price Prediction: Key Levels to Watch
Looking at the weekly chart, ETH just broke above a multi-year downtrend line while holding a rising support structure underneath. Some traders are comparing this setup to the accumulation phase that came before the previous cycle's climb to new highs.
If the pattern continues, here is a rough map of potential resistance zones:
Level
Price Zone
What It Means
First resistance
$2,500 to $2,600
Confirms bullish continuation
Second resistance
$3,200 to $3,500
Mid-range breakout target
Third resistance
$4,000 to $4,800
Approaches prior cycle highs
Prior all-time high
~$4,950
Key psychological level
Extended bullish target
$6,000 to $7,000
Full pattern completion
Stretch target
$8,000+
Only on a decisive ATH break
On the downside, the setup weakens if ETH loses its rising support trendline, especially the $1,500 to $1,750 zone. A drop back into that range would put the bullish pattern in question.
None of these levels are guaranteed. They're based on chart pattern analysis and current momentum, not a promise of where price will land.
GENIUS Act and CLARITY Act: The Regulatory Backdrop
Two US regulatory developments are shaping the longer-term Ethereum price outlook.
The GENIUS Act, which sets a federal framework for stablecoins, becomes effective no later than January 18, 2027. It stops stablecoin issuers from paying yield directly, but leaves room for third-party platforms to offer rewards, which could pressure banks to compete harder for deposits.
The CLARITY Act, which would set clearer market structure rules for crypto, has faced pushback tied to ethics concerns and banking industry resistance.
Supporters argue that if it passes, it could remove compliance barriers that currently keep large institutional players like pension funds and retirement accounts from allocating to crypto at scale.
That kind of steady, recurring institutional buying would look different from the trading-driven demand that has moved crypto in past cycles.
Final Take
Ethereum's move from under $2,000 to over $2,360 in about a week was driven by a real mix of forced short covering, falling exchange balances, and macro liquidity moves, not just hype. ETF inflows and a shift in sentiment add more weight to the bullish case.
Whether ETH can push through $2,500 and hold it will likely decide if this turns into a longer trend or just a sharp relief bounce.
Disclaimer: This article is for informational purposes only and does not constitute financial or investment advice. Cryptocurrency prices are highly volatile, and past performance does not guarantee future results. Always do your own research and consult a licensed financial advisor before making investment decisions.