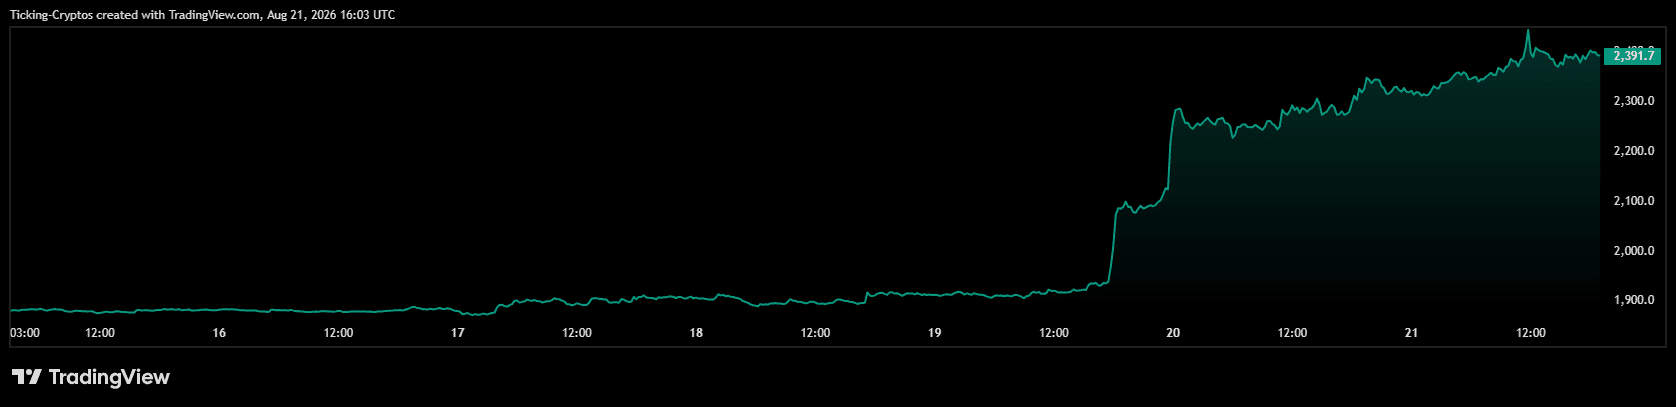
Ethereum is trading at $2,389 at the time of writing, up 2.73% on the day after opening at $2,326 and reaching $2,396. The intraday high has come within four dollars of $2,400, a level that h
Ethereum is trading at $2,389 at the time of writing, up 2.73% on the day after opening at $2,326 and reaching $2,396. The intraday high has come within four dollars of $2,400, a level that has capped every rally since April.
Ethereum price in USD
The headline number understates what actually happened. ETH has gone from roughly $1,900 to nearly $2,400 in three sessions. That is a move of about 25% on the week, and it delivered Ethereum's largest single-day gain since May 2025.
More to the point, $ETH is not simply following Bitcoin higher. It is running ahead of it. For an asset that spent most of 2026 as the market's underperformer, that reversal is the actual story here.
Why is the Ethereum price above $2,300?
Ethereum is above $2,300 because capital is rotating out of Bitcoin and into ETH for the first time this cycle, and it is hitting a float that has been quietly shrinking all year.
The initial trigger was shared with the rest of the market. What happened afterwards was not. On 20 August, Ethereum surged nearly 20% in a single day, its largest one-day gain since 9 May 2025, far outperforming Bitcoin, which rose close to 10% on the same session.
That gap is the whole point. Ethereum has a higher beta than Bitcoin, meaning it moves harder in both directions when conditions shift. But beta alone does not explain a 25% week. Three specific mechanisms did the work.
Reason 1: What is the ETH/BTC breakout actually signalling?
The ETH/BTC ratio has broken out of a multi-month base, which is the earliest and most reliable signal that market leadership is rotating from Bitcoin toward Ethereum.
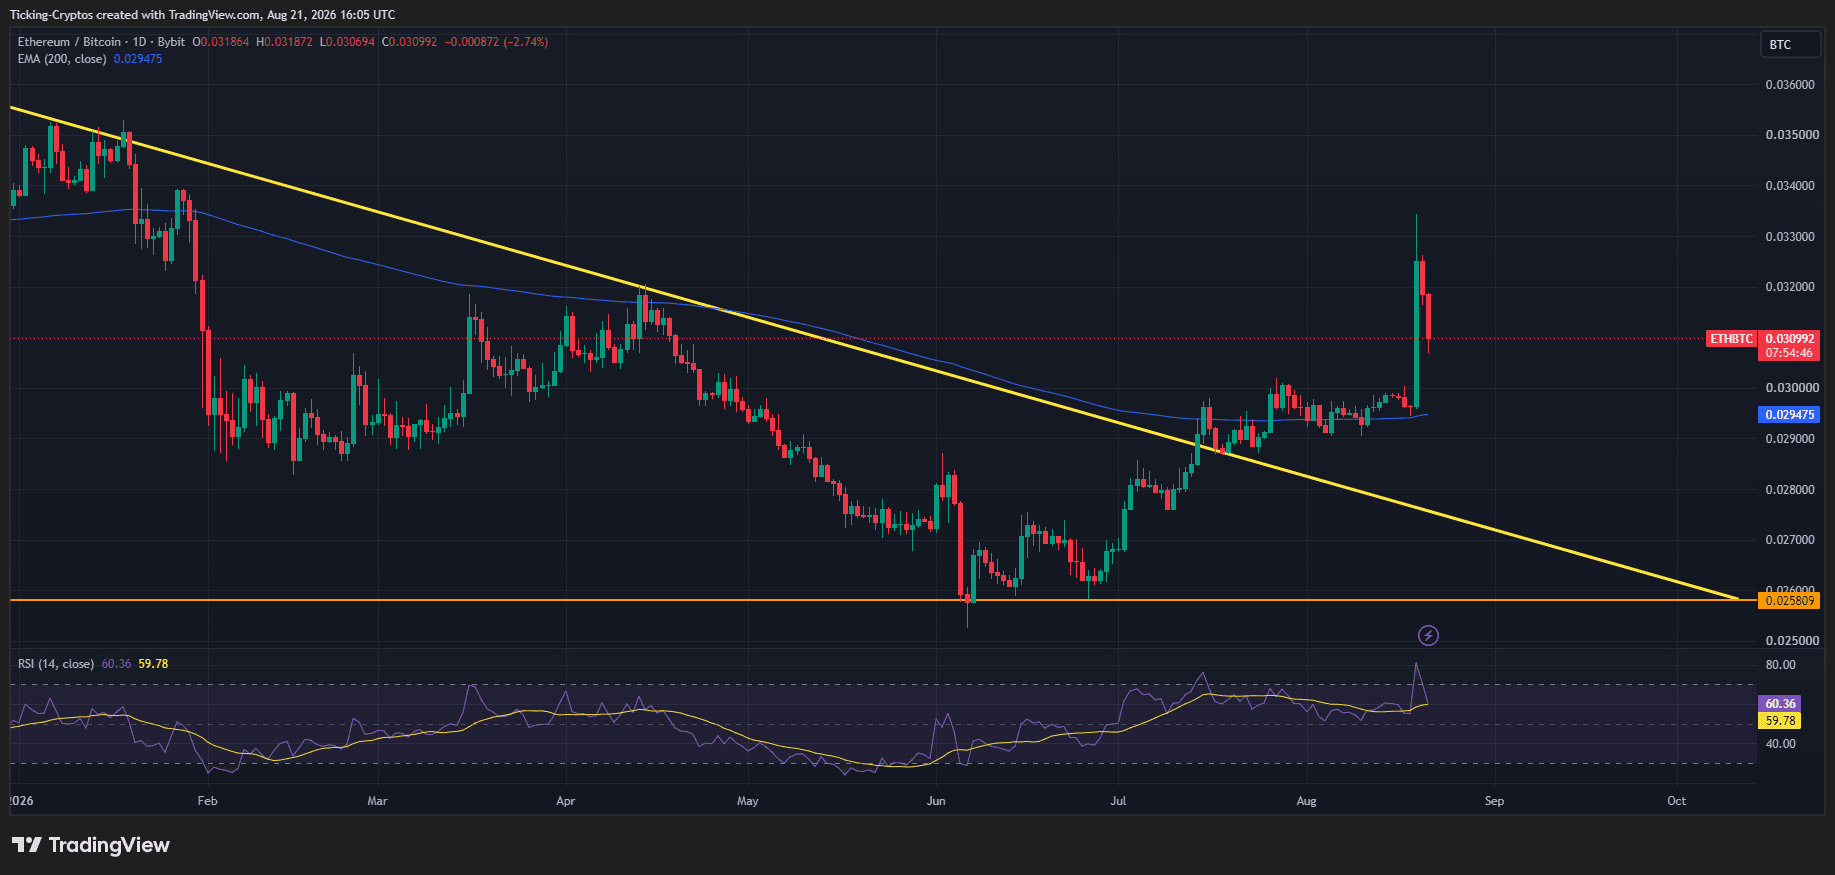
For most of 2026, this ratio sat near multi-year lows. Ether had fallen harder than Bitcoin's roughly 52% drawdown, extending a multi-year stretch of underperformance against the market leader. Every Ethereum rally this year failed because the ratio kept grinding down, meaning capital was leaving ETH even when the dollar price rose.
That has now changed. A cup-and-handle setup had formed on the ETH/BTC daily chart between May and July, with its base near 0.0254 BTC and a neckline around 0.0298 to 0.0300 BTC, and a decisive daily close above 0.0300 BTC would target 0.0345 to 0.0355 BTC. Analyst Michaël van de Poppe noted the pair swept all the way toward 0.033 BTC during the move.
Why this matters more than the dollar chart: if the ratio holds its breakout, Ethereum keeps gaining even in sessions where Bitcoin goes sideways. That is a fundamentally different setup from a market where ETH only rises when BTC drags it up.
Fundstrat's Tom Lee has argued that the tailwind for ETH over the next few years is larger than the previous ICO and NFT cycles, and expects the ETH/BTC ratio to make a sizeable move higher.
Want to trade Ethereum's volatility alongside indices and forex from one account?Open an account with XTB and access CFDs on 39 cryptocurrencies with no inactivity fee.

CFDs are complex instruments and come with a high risk of losing money rapidly due to leverage. A high percentage of retail investor accounts lose money when trading CFDs. You should consider whether you understand how CFDs work and whether you can afford to take the high risk of losing your money.
Reason 2: How did Ethereum's shrinking float amplify the move?
Ethereum's tradable supply on exchanges sits at historic lows because coins are locked in staking contracts and Layer-2 networks, so a given amount of buying moves the price much further than it would have two years ago.
This is the driver most coverage misses, and it is entirely specific to Ethereum. Bitcoin has no equivalent. The rally was heavily amplified by historically low exchange inventories resulting from assets locked in Layer-2 networks and staking protocols.
The mechanism is simple. Staked ETH is not sitting on an order book. Neither is ETH bridged into Layer-2 ecosystems. When demand arrives, it competes for a much thinner pool of immediately sellable coins than the headline supply figure suggests.
Layer leverage on top of that and you get violent moves. A $1.9 billion short liquidation cascade forced leveraged traders to cover, and 24-hour trading volume reached $38 billion as the price action accelerated. ETH open interest briefly jumped to $13 billion during the move.
The caution here is the mirror image of the same mechanic. A thin float cuts both ways. The same structure that made the upside violent will make any unwind equally fast, because there is no depth of resting bids underneath either.
Reason 3: Are ETF flows finally rotating into Ethereum?
Yes, spot Ethereum ETFs are pulling in meaningful inflows again, and the September regulatory calendar matters more for ETH than it does for Bitcoin.
Spot Ethereum ETFs attracted $189 million in net inflows on 19 August, supporting the rally. That figure sits on top of an earlier shift. Ethereum ETFs pulled in roughly $71 million over one seven-day stretch in July while Bitcoin ETFs shed around $200 million, marking a third consecutive week of net ETH inflows.
Concentration is worth understanding here. BlackRock's ETHA controls roughly 68% of US spot ETH ETF assets, and institutional capital routes through the cheapest and most liquid vehicle. Flow into Ethereum is effectively flow into one fund, which makes the numbers easier to track but also more fragile if that single vehicle turns.
The regulatory piece is where Ethereum has more at stake than Bitcoin. The Senate's first procedural vote on the CLARITY Act is set for 15 September 2026, and clearing cloture would open debate on the framework determining how DeFi and perpetual exchanges tied to ETH get regulated. Bitcoin's regulatory status is largely settled. Ethereum's DeFi and staking ecosystem is precisely what that bill governs.
What does the Ethereum chart show at $2,400?
Ethereum has reclaimed its 200-day EMA at $2,128 and is now pressed directly against $2,400, the horizontal that has rejected every rally since April.
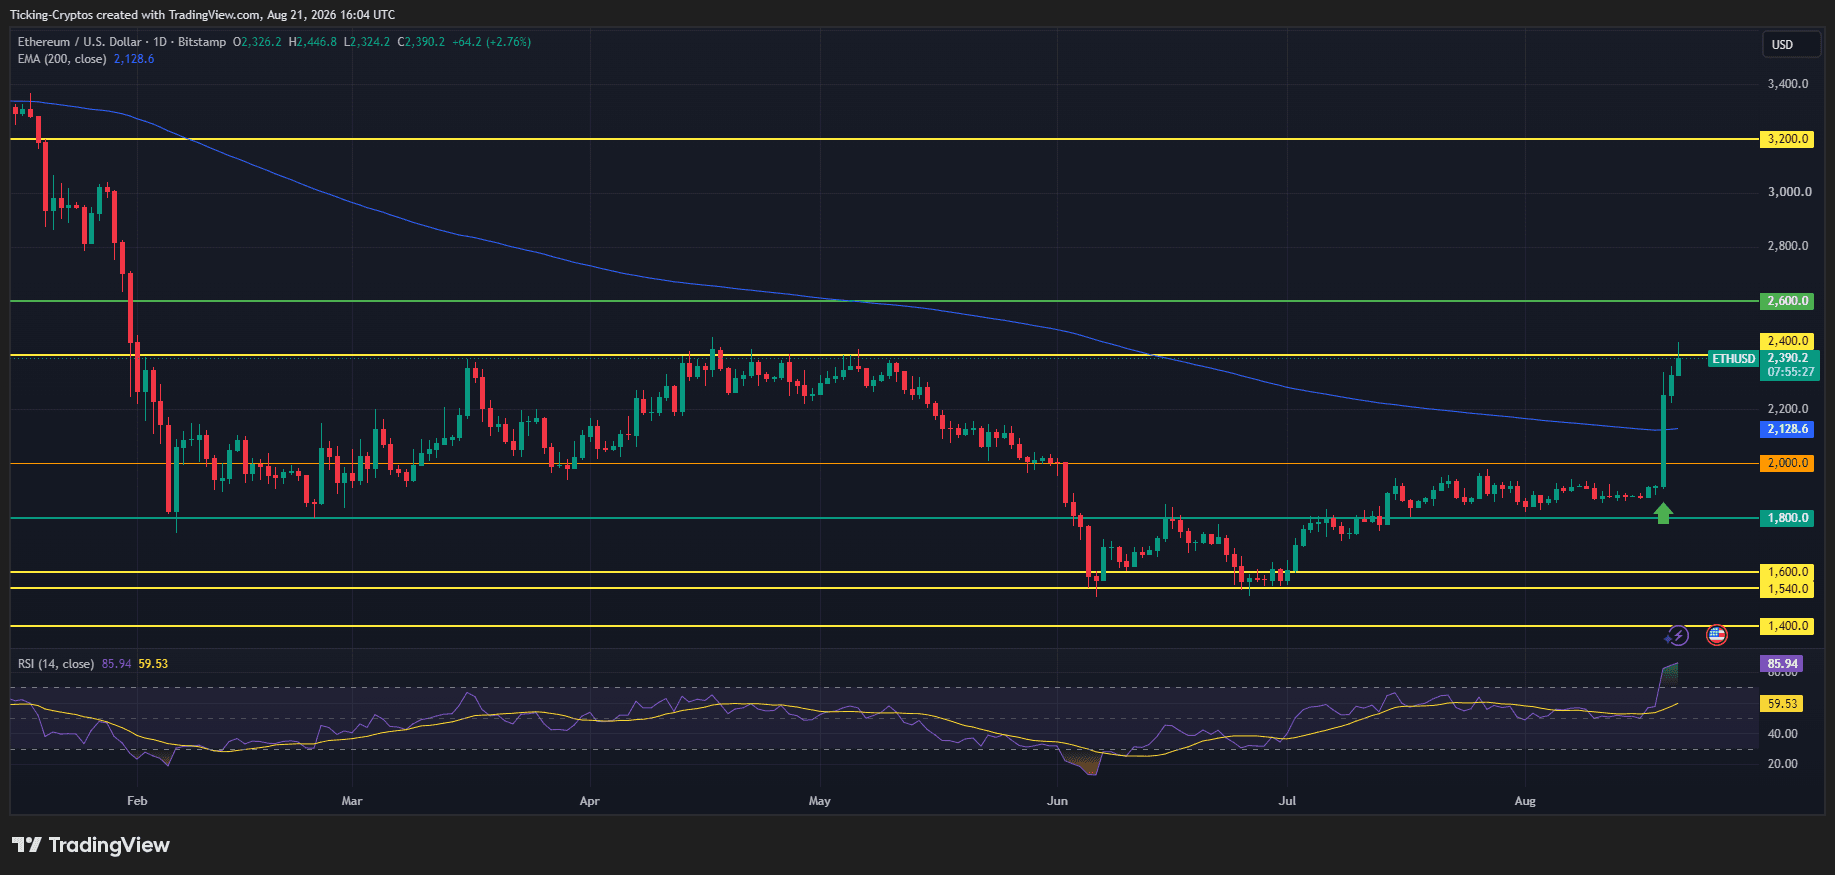
The structure has changed completely. From June onward, ETH was locked between roughly $1,800 and $2,000, with the $1,600 and $1,540 zones marking the lower shelf and $1,500 as the June capitulation low. The current candle cut through all of it, took out the descending 200-day EMA at $2,128 in a single move, and has parked itself directly beneath $2,400.
Today's candle opened at $2,326 and its low is $2,324. Effectively no downside was traded. That tells you sellers have not shown up yet at these levels, which is unusual after a 25% week.
The obvious problem is momentum. The daily RSI is at 85.92 against a signal line at 59.53. That is a more extreme reading than Bitcoin printed during the same rally, and it is one of the highest on the entire ETH chart. Readings above 85 almost never resolve through continued vertical gains. They resolve through either a sharp flush or a sideways grind while the indicator cools.
What is the next Ethereum price target above $2,400?
A daily close above $2,400 opens the path directly to $2,600, with very little structural resistance in between.
The $2,400 line is the gate. It capped ETH in April and again in early May, and price is sitting a few dollars underneath it right now. A close above turns it from resistance into support and leaves $2,600 as the next mapped level, roughly 8.8% higher.
What makes that gap interesting is how thin it is. ETH spent very little time between $2,400 and $2,600 during the spring decline, so there is not much trapped supply waiting to sell into a rally there.
LevelDistance from $2,389Role$2,400+0.5%The gate, must close above it$2,600+8.8%Next mapped resistance, thin air below it$2,128-10.9%200-day EMA, the trend line$2,000-16.3%Psychological floor and old range top$1,800-24.7%Structural support, the June to August base
Where does the bullish Ethereum setup break?
The setup fails on a daily close back below the 200-day EMA at $2,128, and the $2,000 level is the last line before the entire move is given back.
Rejection at $2,400 without a close above it would be the first warning. That alone would not break the structure, since a pullback to test the reclaimed EMA would be normal and arguably healthy after a move this steep.
Losing $2,128 is different. That would put Ethereum back below the line that defines its long-term trend and would strongly favour the reading that this was a liquidation-driven spike rather than a genuine rotation.
One thing to keep in perspective: ETH remains far from recovered. Ethereum is still down substantially in 2026 and well below its 2025 peak near $5,000. A move to $2,600 would be a strong recovery within a bear market, not a return to previous highs.
Ethereum price prediction: can ETH reach $2,600?
$2,600 is achievable in the coming weeks provided the ETH/BTC ratio holds its breakout, because that is what separates a genuine rotation from a beta-driven bounce.
The bull case has three legs and they reinforce each other. Rotation out of Bitcoin gives ETH a bid that does not depend on BTC rising. The locked-up float means that bid moves price efficiently. And the September CLARITY vote gives the DeFi ecosystem a concrete catalyst that Bitcoin does not have.
The bear case is equally clear. An RSI near 86 is stretched by any standard. Much of the fuel was forced short covering rather than spot accumulation, and the ETF flow story, while real, is running through a single dominant fund. If ETH/BTC rolls back under its breakout level, the rotation thesis collapses and ETH goes back to being a high-beta proxy for Bitcoin.
The most constructive outcome would be a pause. A consolidation between $2,128 and $2,400 that cools the RSI while the ratio holds would build a far better base for $2,600 than another vertical push.
Watch two things: the daily close against $2,400, and the ETH/BTC ratio holding above its breakout. The dollar chart tells you what happened. The ratio tells you whether it lasts.