Key Takeaways ETH has traded below its 2021 peak for nearly five years. Bridge deposits to Robinhood Chain jumped 10x last week. ETH ETFs turned positive after eight weeks of outflows. Silver
Key Takeaways
- ETH has traded below its 2021 peak for nearly five years.
- Bridge deposits to Robinhood Chain jumped 10x last week.
- ETH ETFs turned positive after eight weeks of outflows.
- Silver just broke its own multi-decade ceiling higher.
Where Ethereum Actually Stands
ETH trades near $1,770, still roughly 60% below its August 2025 all-time high near $4,900 and 47% below its January 2026 peak. The daily 50-SMA at $2,040 is the first structural level overhead, and everything above it, the 100-SMA near $2,420 and the 200-SMA near $3,080, describes a market that has spent the year distributing rather than accumulating. It’s worth noting also that pullback might be coming. For now waiting for a clean breakout and successful retest for confirmation that the uptrend continues could be a smart move.
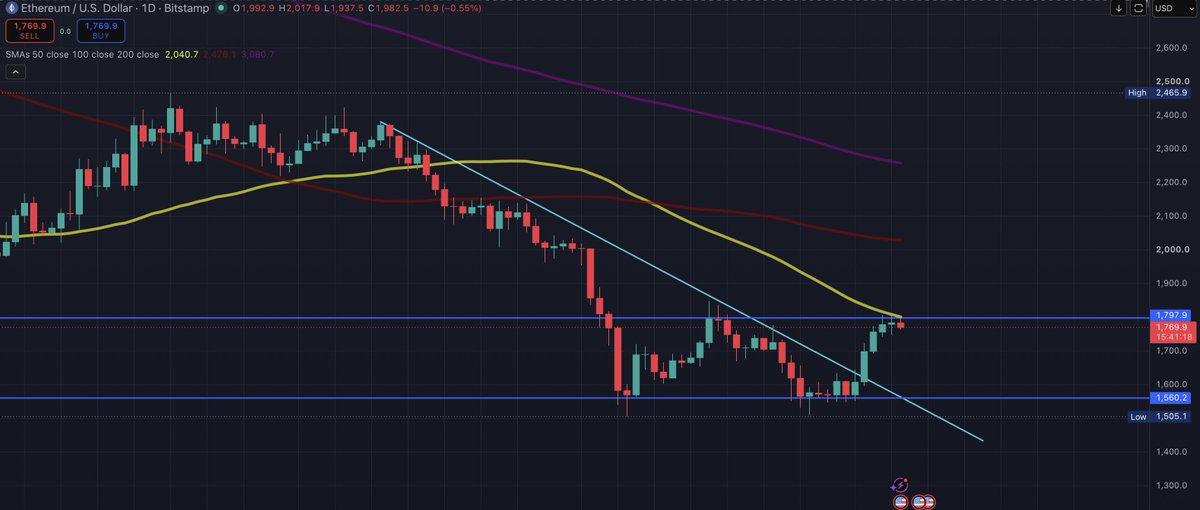
ETH/USD daily technical chart analysis /
Source: TradingViewThe Silver Comparison Is Worth Taking Seriously
The bigger frame is the one that matters. Ethereum has now spent nearly five years unable to reclaim its previous cycle high despite many of the biggest cryptos doing it, an unusually long consolidation for a top-two crypto asset.
Silver also spent decades trapped below its 1980 and 2011 peaks near $48. The metal recently broke that ceiling and, in a single-month move, more than doubled toward $121.
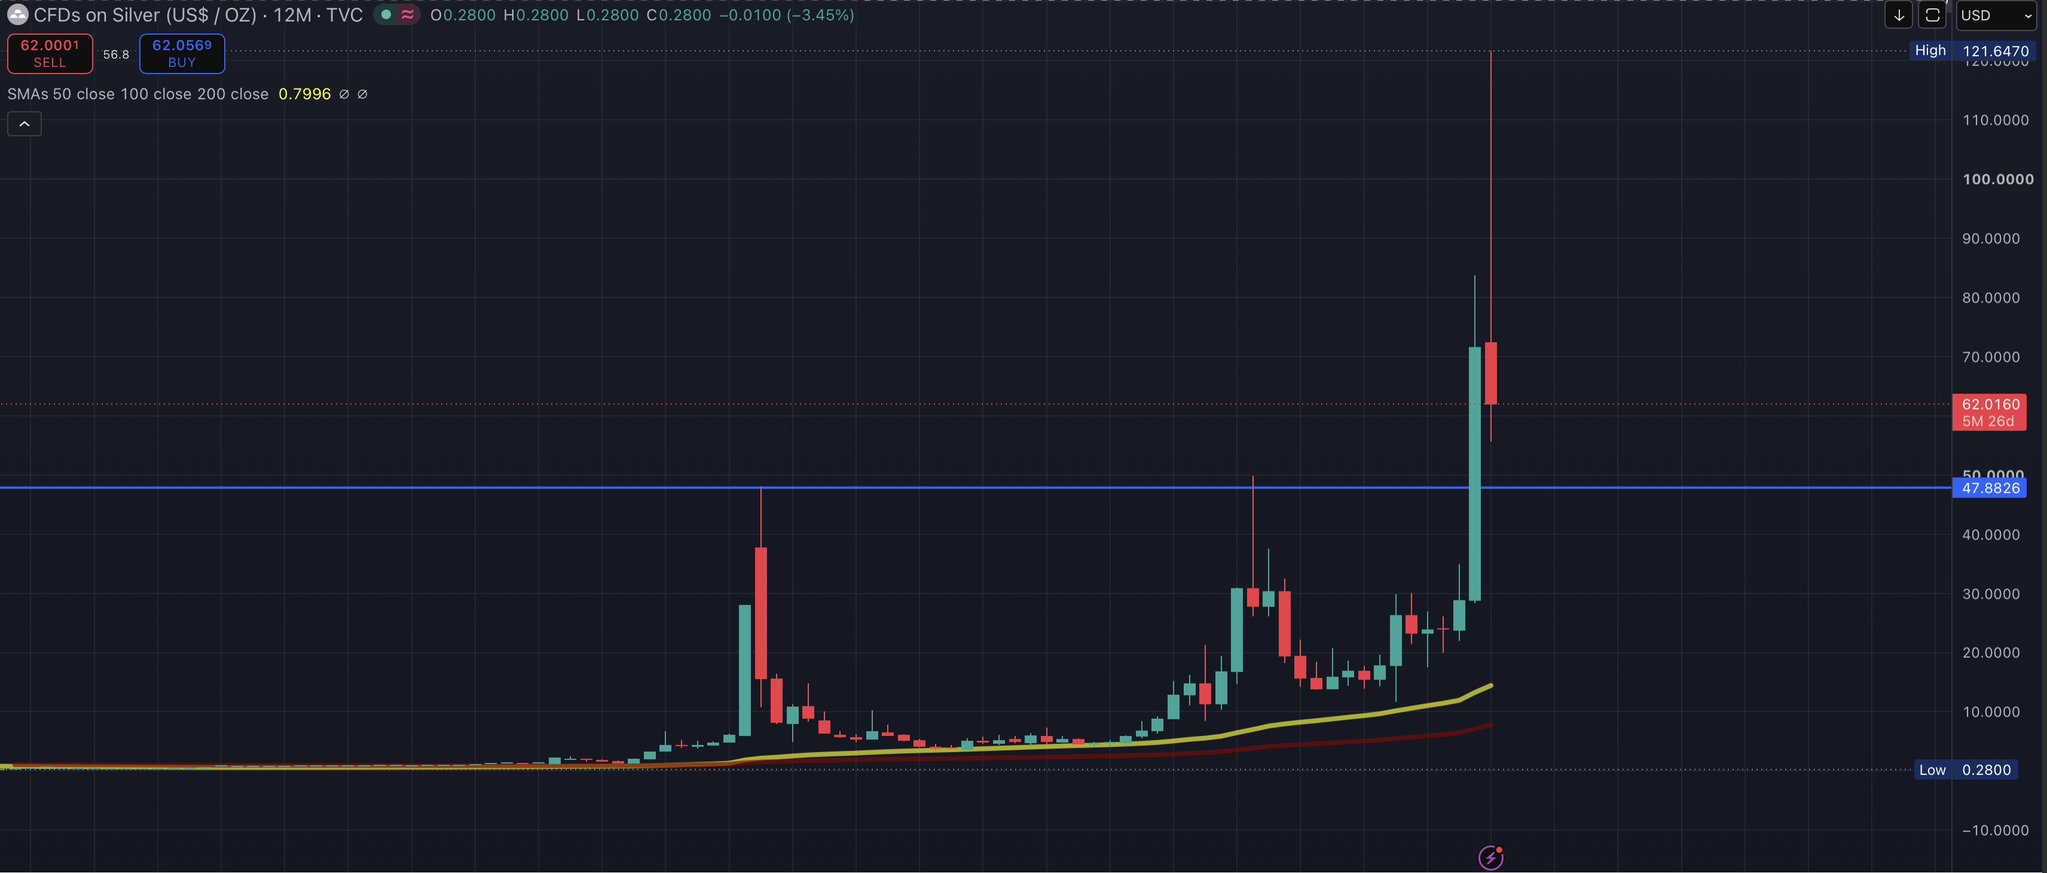
Monthly technical chart illustrating a sudden vertical surge in Silver CFD prices.
The pattern is straightforward: assets that spend years compressed below a former high often store the volatility they didn’t spend, and sometimes release it once the level breaks. It is not a prediction that ETH will follow silver’s trajectory. It is a reminder that multi-year ceilings, when they break, could break violently.
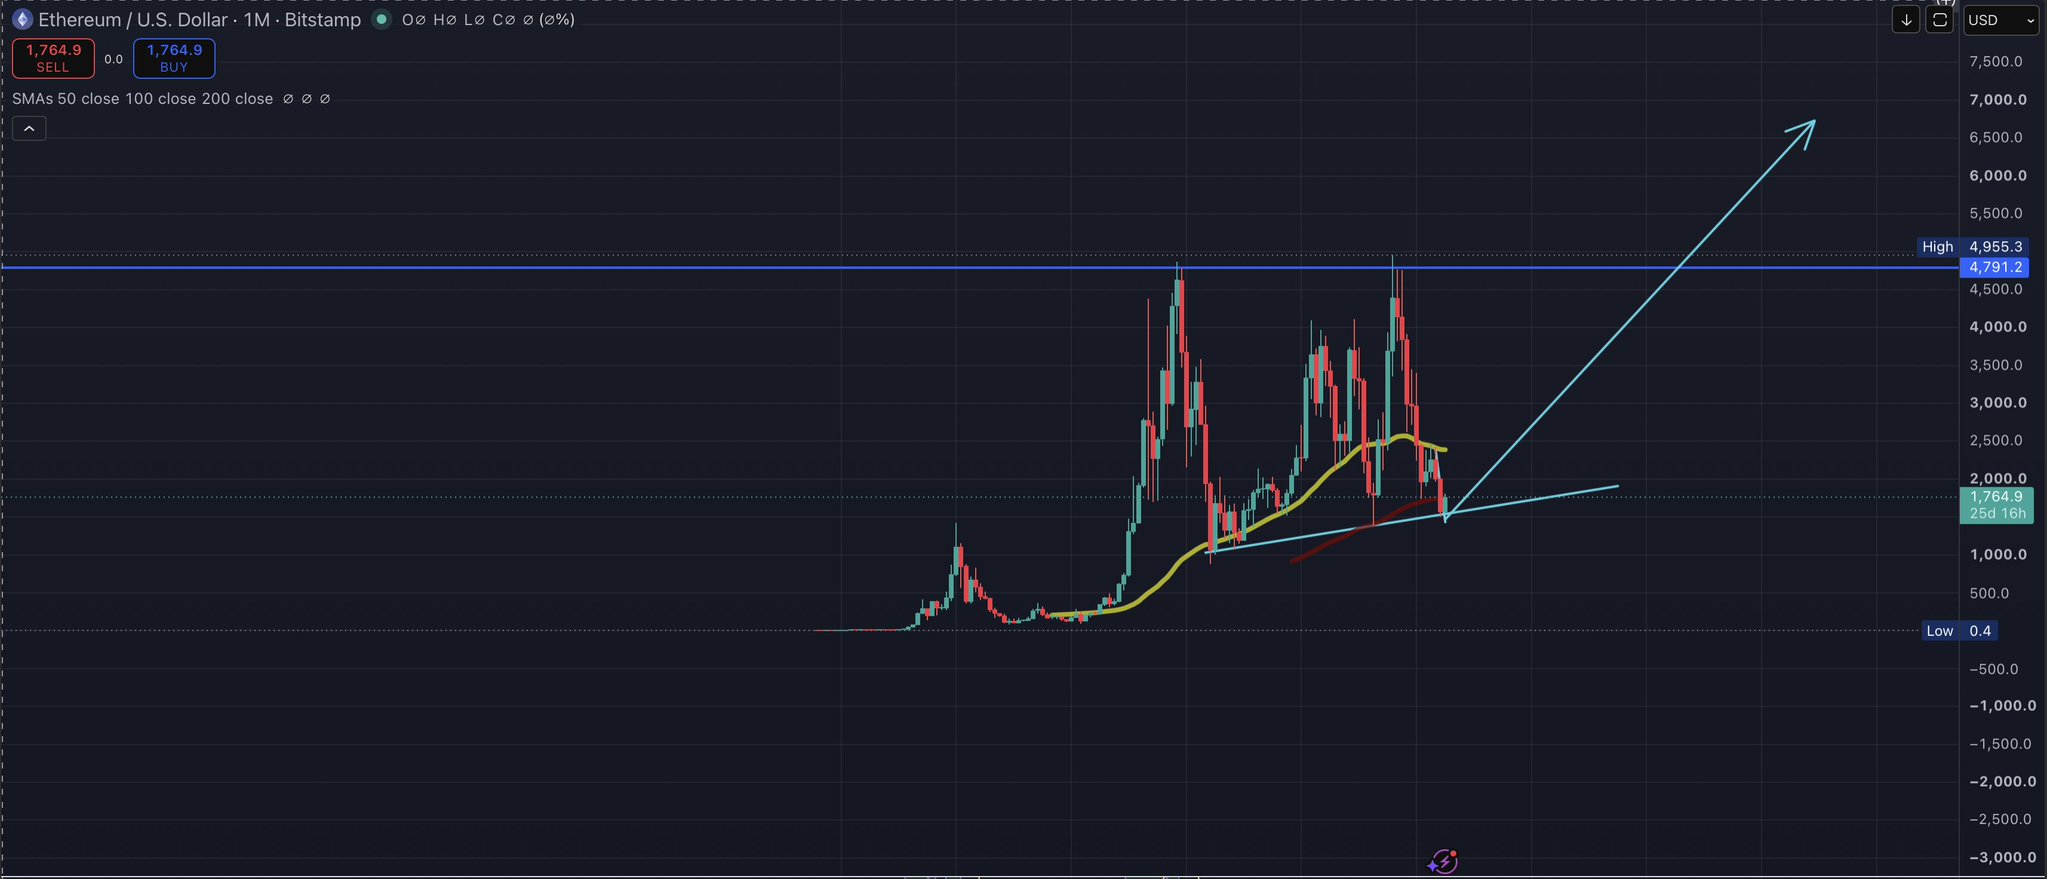
Monthly ETH/USD technical analysis with a bullish trend projection.
Three Signals Turning at Once
The reason this setup is worth flagging now, rather than a month ago, is that three independent datasets have started moving in the same direction after months of drift.
- First, ETF flows: Ethereum spot ETFs recorded eight consecutive weeks of net outflows through late June, per SoSoValue data, but reversed on July 1 and July 2 with $14.89 million and $29.08 million of inflows. Two green sessions do not undo two months of redemptions, but they are the first sign institutional selling has paused.
- Second, on-chain demand:Token Terminal revealed on X that ETH bridged from mainnet to Robinhood Chain surged roughly 10x in the final days of June, from near-zero to nearly $10 million in daily bridge deposits. Robinhood’s Ethereum-based Layer-2 is being used by the retail broker’s own customers, meaning the flow represents new users buying ETH to hold or transact on it, exactly the category that has been missing lately.
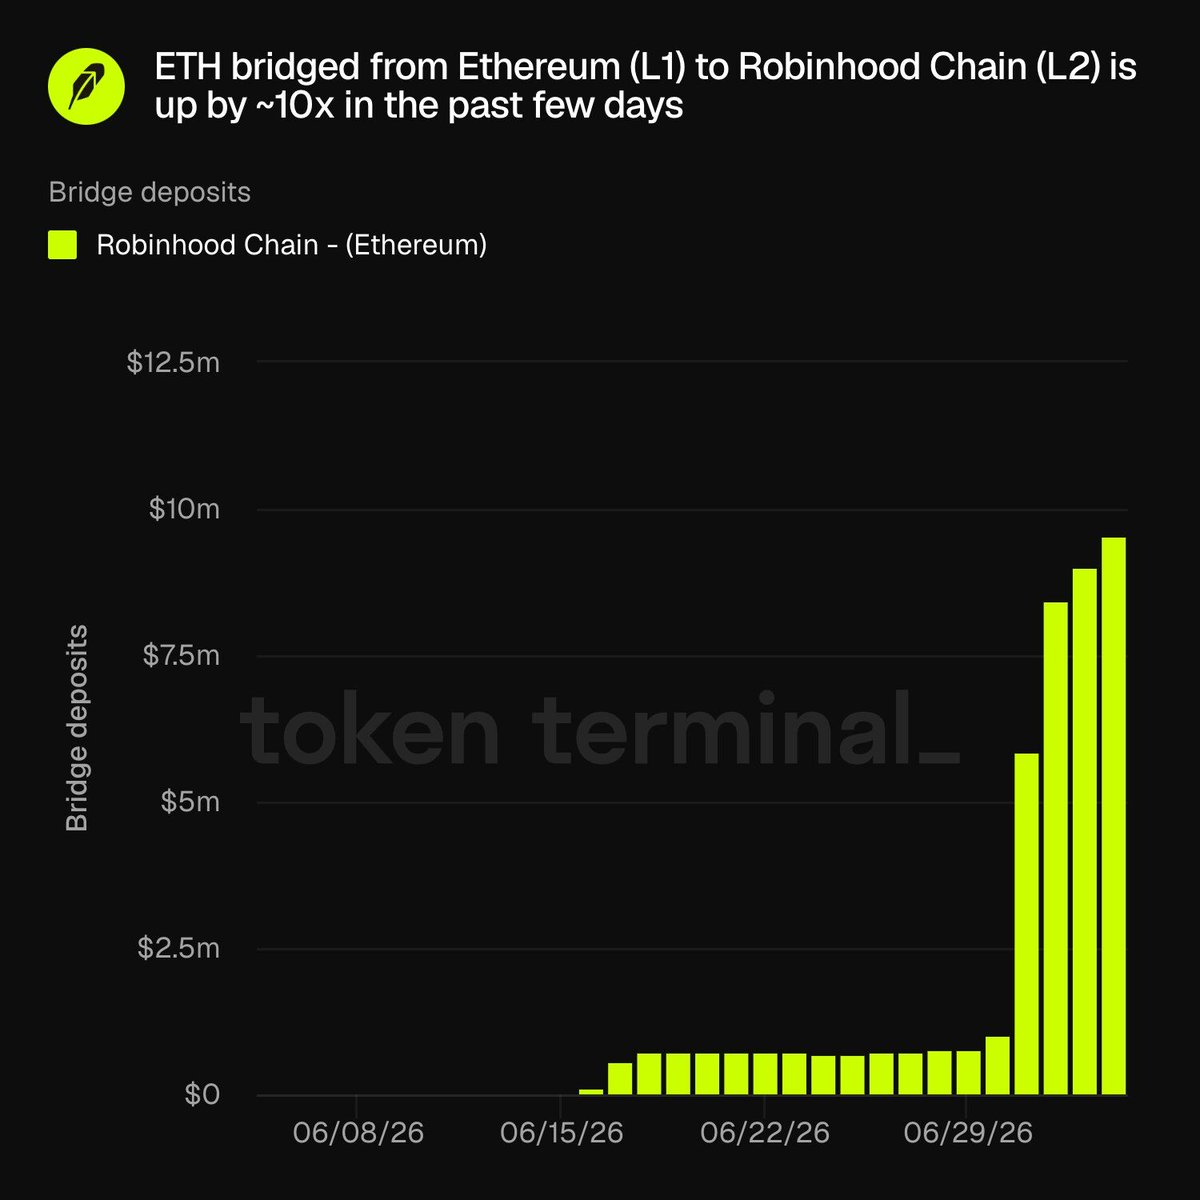
Significant surge in ETH bridge deposits to the Robinhood Chain in late June 2026.
- Third, price structure: ETH has reclaimed the descending trendline that capped every rally since February and is now testing the daily 50-SMA at $2,040. A weekly close above that level could be the first trend break of the year.
Nothing here confirms a reversal. ETH remains in a downtrend, ETF flows have been red for two months, and the silver comparison rests on pattern, not causation. What has changed is that the setup now has real components: a five-year compression, a fresh demand vector (Robinhood Chain), and the first ETF green print since May. If the daily 50-SMA gives way and the bridge activity persists, the setup could stop being only theoretical. Until then, ETH sits exactly where the last rally attempts died.
This article is for informational purposes only and does not constitute financial or investment advice. Cryptocurrency markets are highly volatile. Always conduct your own research before making investment decisions.
The post Ethereum Price: Analyzing the Latest Signals appeared first on Coindoo.