Ethereum price has recovered to around $2,493 after a sharp fall toward $2,400, but its daily Supertrend has turned bearish, and the 4-hour chart still shows negative money flow. Summary Ethe
Ethereum price has recovered to around $2,493 after a sharp fall toward $2,400, but its daily Supertrend has turned bearish, and the 4-hour chart still shows negative money flow.
Summary
- Ethereum price trades near $2,493 after recovering from its sharp decline toward $2,400.
- Daily Supertrend resistance stands at $2,764, above Ethereum’s current price.
- The 4-hour Bollinger midpoint at $2,569 marks the next recovery hurdle.
- U.S. spot Ethereum ETFs recorded $486.1 million in outflows across four trading sessions.
Ethereum price struggles to recover $2,500
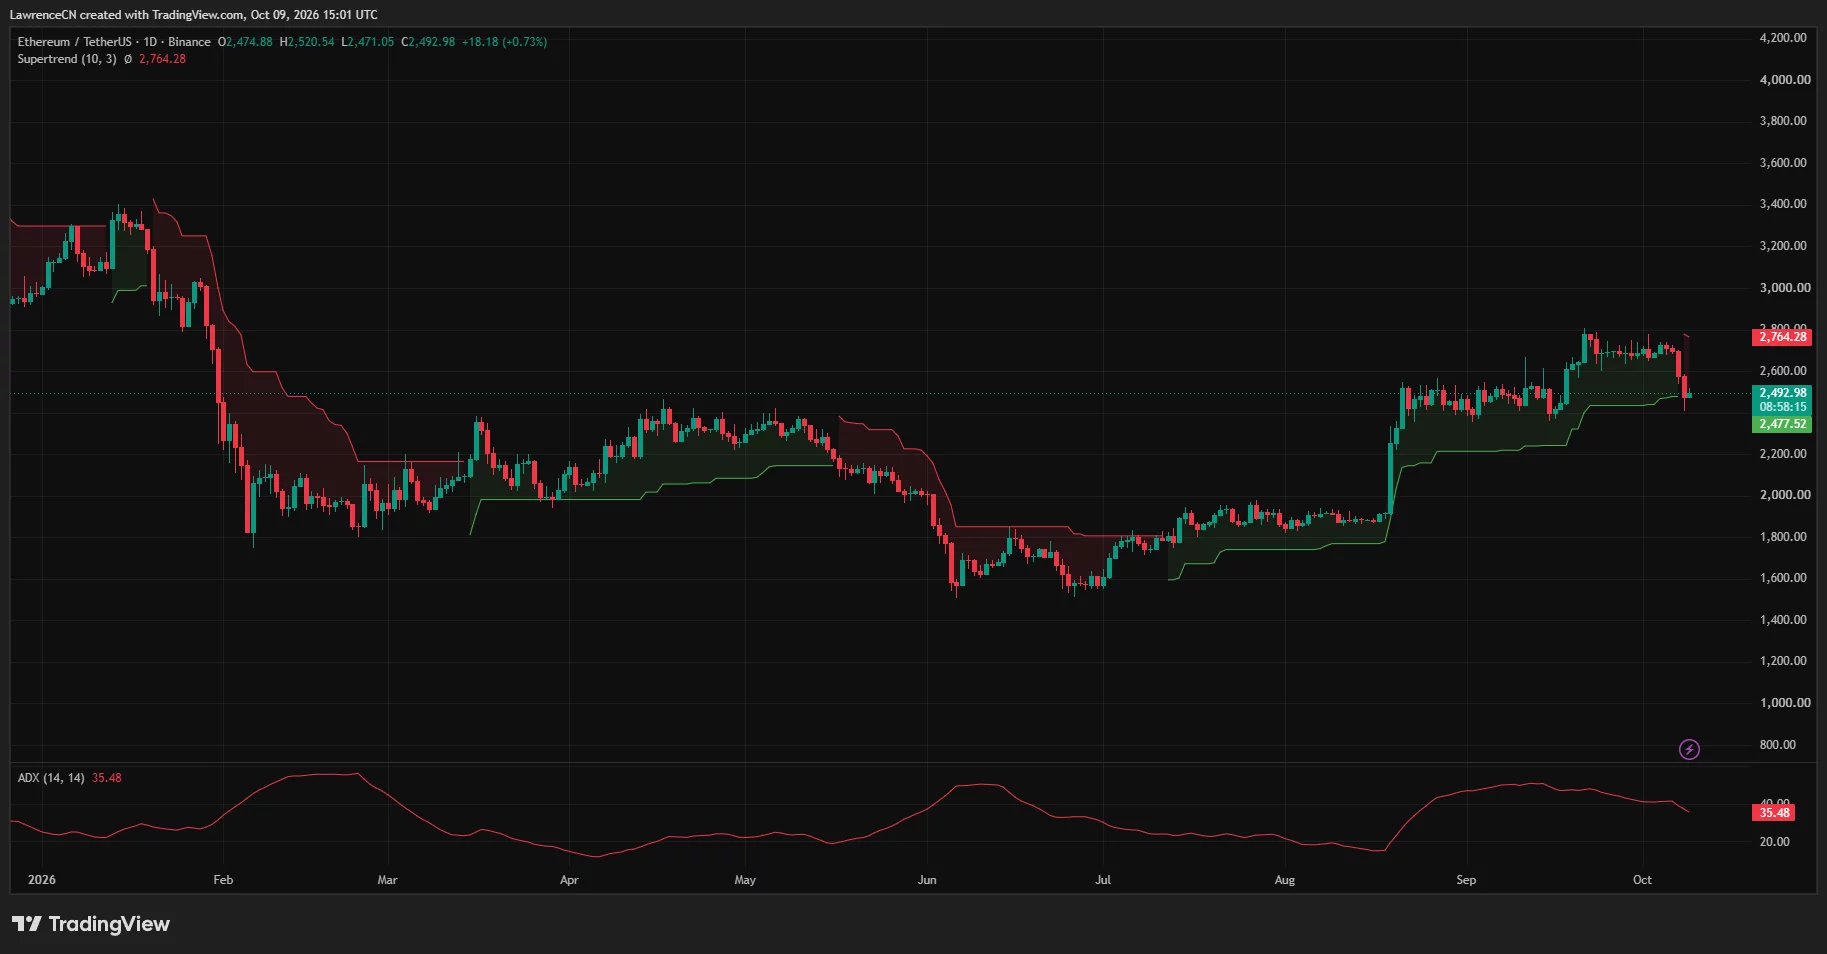
TradingView’s Binance ETH/USDT daily chart showed Ethereum at $2,492.98 on Oct. 9, up 0.73% for the session. The day’s price range extended from $2,471.05 to $2,520.54, leaving ETH below $2,500 despite an earlier move above that level.
The daily chart shows a sharp reversal from the trading range established near $2,650–$2,750 in late September and early October. Ethereum’s latest bounce has recovered only part of that decline, with the price still below the area where it traded before selling accelerated.
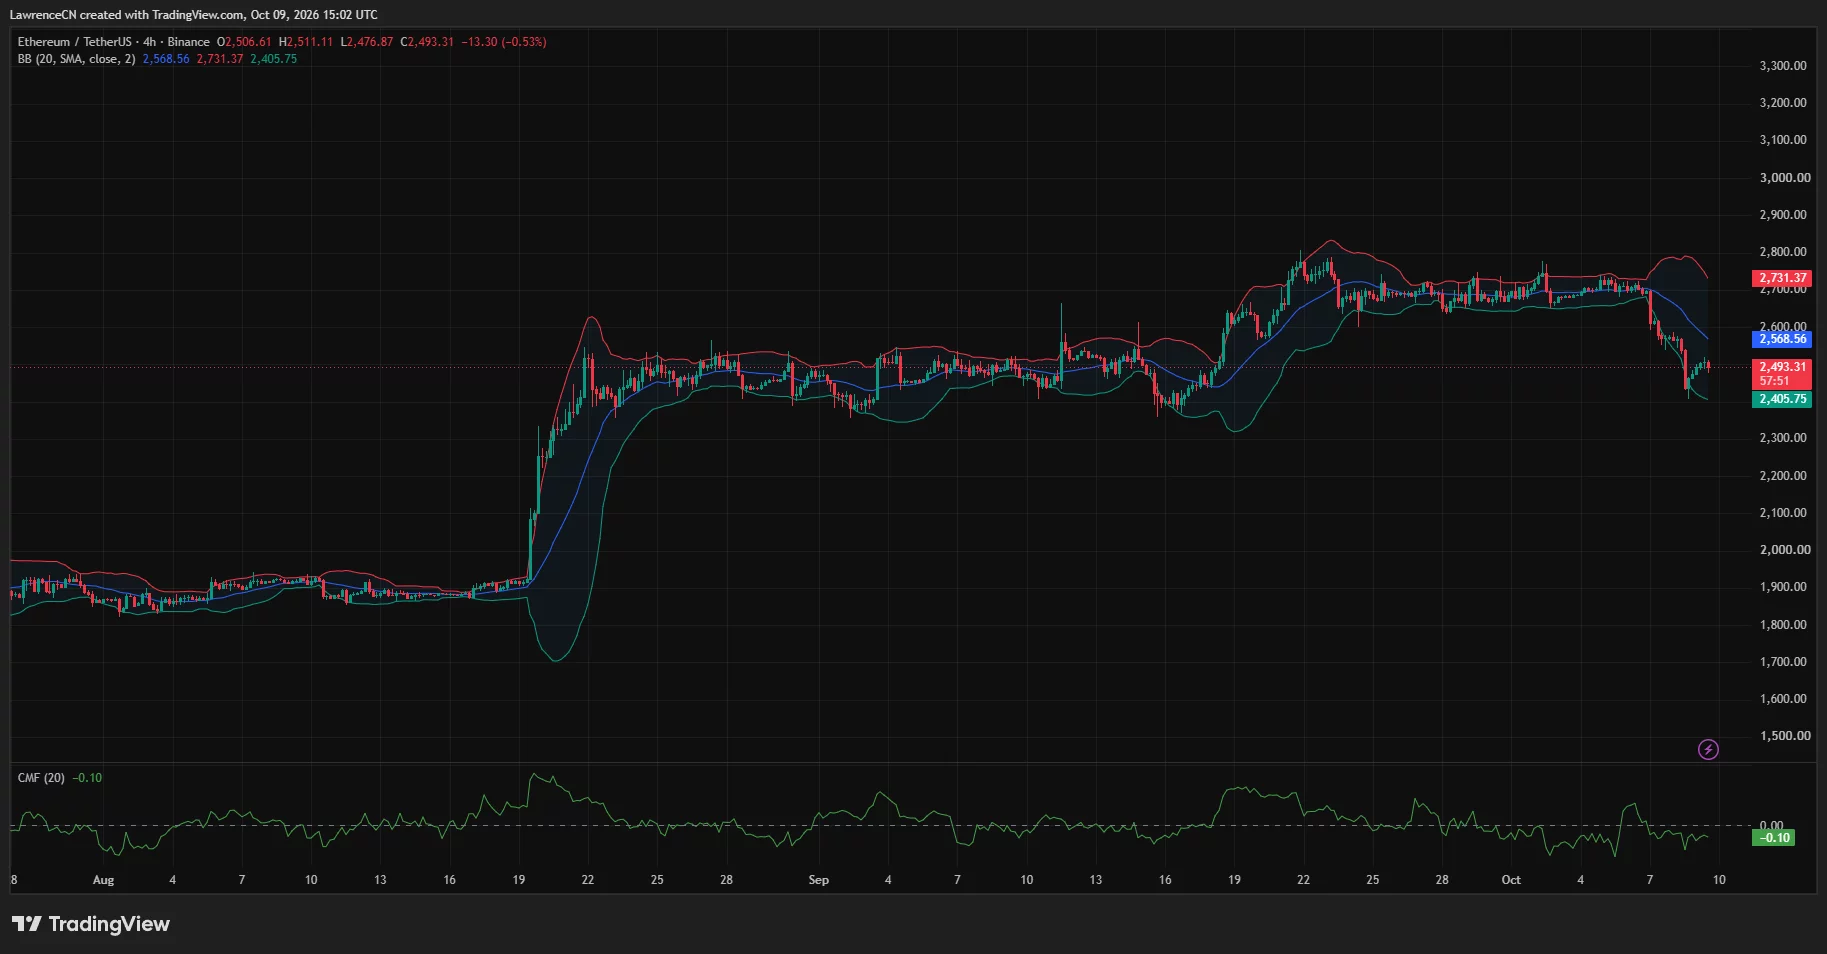
On the 4-hour TradingView chart, ETH stood at $2,493.31 after falling 0.53% during the displayed period. Its recovery from the recent low had stalled near $2,500, while the latest candles remained below the chart’s falling moving average.
You might also like: Ethereum’s Glamsterdam upgrade could ease DeFi congestion, Curve says
Analyst Ella identified $2,500 as the first level buyers need to reclaim in an Oct. 9 post. She described Ethereum’s move from approximately $2,700 to a wick near $2,400 as a decline of close to 11%, with selling accelerating toward the end.
Ella said a recovery above $2,500 could ease some of the panic, while failure to regain that level would leave the bounce vulnerable. Her assessment places the immediate focus on whether Ethereum can hold above the round-number threshold after briefly trading through it.
Daily Supertrend turns bearish above ETH
The daily TradingView chart displayed a red Supertrend reading at $2,764.28 following Ethereum’s latest sell-off. The indicator had previously tracked below the price during the advance from August into September.
Ethereum price daily chart — Oct. 9 | Source: TradingView
Its shift above ETH places the daily trend signal on the bearish side. At approximately $2,493, Ethereum traded nearly 10% below the Supertrend level, leaving a substantial gap between the rebound and a potential reversal of that signal.
The earlier green Supertrend line ended around $2,477.52, close to the current price. Ethereum’s sharp downward wick passed below that area before the rebound, while the newly displayed red line established a higher resistance threshold.
TradingView’s daily Average Directional Index stood at 35.48. The reading remained above 25, a commonly used threshold for an established trend, although the line had declined from its September highs.
ADX measures trend strength rather than direction. In Ethereum’s current setup, the bearish direction comes from the Supertrend change and the price breakdown, while the falling ADX shows that measured trend strength has eased from earlier readings.
The daily chart also places the former $2,650–$2,750 trading range above the market. A recovery into that area would retrace more of the recent fall, but ETH would still need to clear the Supertrend resistance near $2,764 to reverse the indicator’s bearish setting.
The 4-hour chart puts $2,569 ahead of a stronger recovery
Ethereum’s 4-hour Bollinger Bands showed a midpoint of $2,568.56, an upper band of $2,731.37 and a lower band of $2,405.75. ETH traded in the lower half of that range after bouncing from near the lower boundary.
Ethereum price 4-hour chart — Oct. 9 | Source: TradingView
The midpoint stood roughly 3% above the displayed price. A move above $2,500 would therefore clear the nearest round-number hurdle while leaving the 20-period moving average around $2,569 as the next technical test.
The bands had widened during the sell-off, with the upper boundary rising and the lower boundary falling. On the chart, that expansion accompanied the break from Ethereum’s earlier consolidation around $2,700.
The 4-hour Chaikin Money Flow reading was negative at -0.10. The indicator’s position below zero points to selling pressure across its measurement period, even after Ethereum recovered from the low.
Together, the price below the Bollinger midpoint and negative CMF leave the short-term recovery without a clear bullish confirmation. A sustained move above $2,569 alongside CMF returning above zero would strengthen the recovery case on that timeframe.
On the downside, the lower Bollinger Band near $2,406 overlaps with the recent price trough around $2,400. A break below that zone would take Ethereum beneath both the latest low area and the displayed band boundary.
ETF withdrawals continue as liquidation clusters sit overhead
Farside Investors recorded $201.9 million in U.S. spot Ethereum ETF outflows on Oct. 6 and another $160.9 million on Oct. 7. Combined withdrawals reached $362.8 million across those two sessions.
The same dataset showed $72.5 million in further outflows on Oct. 8. Including the $50.8 million withdrawn on Oct. 5, net redemptions totaled $486.1 million across four trading sessions, extending the funds’ outflow streak to eight sessions.
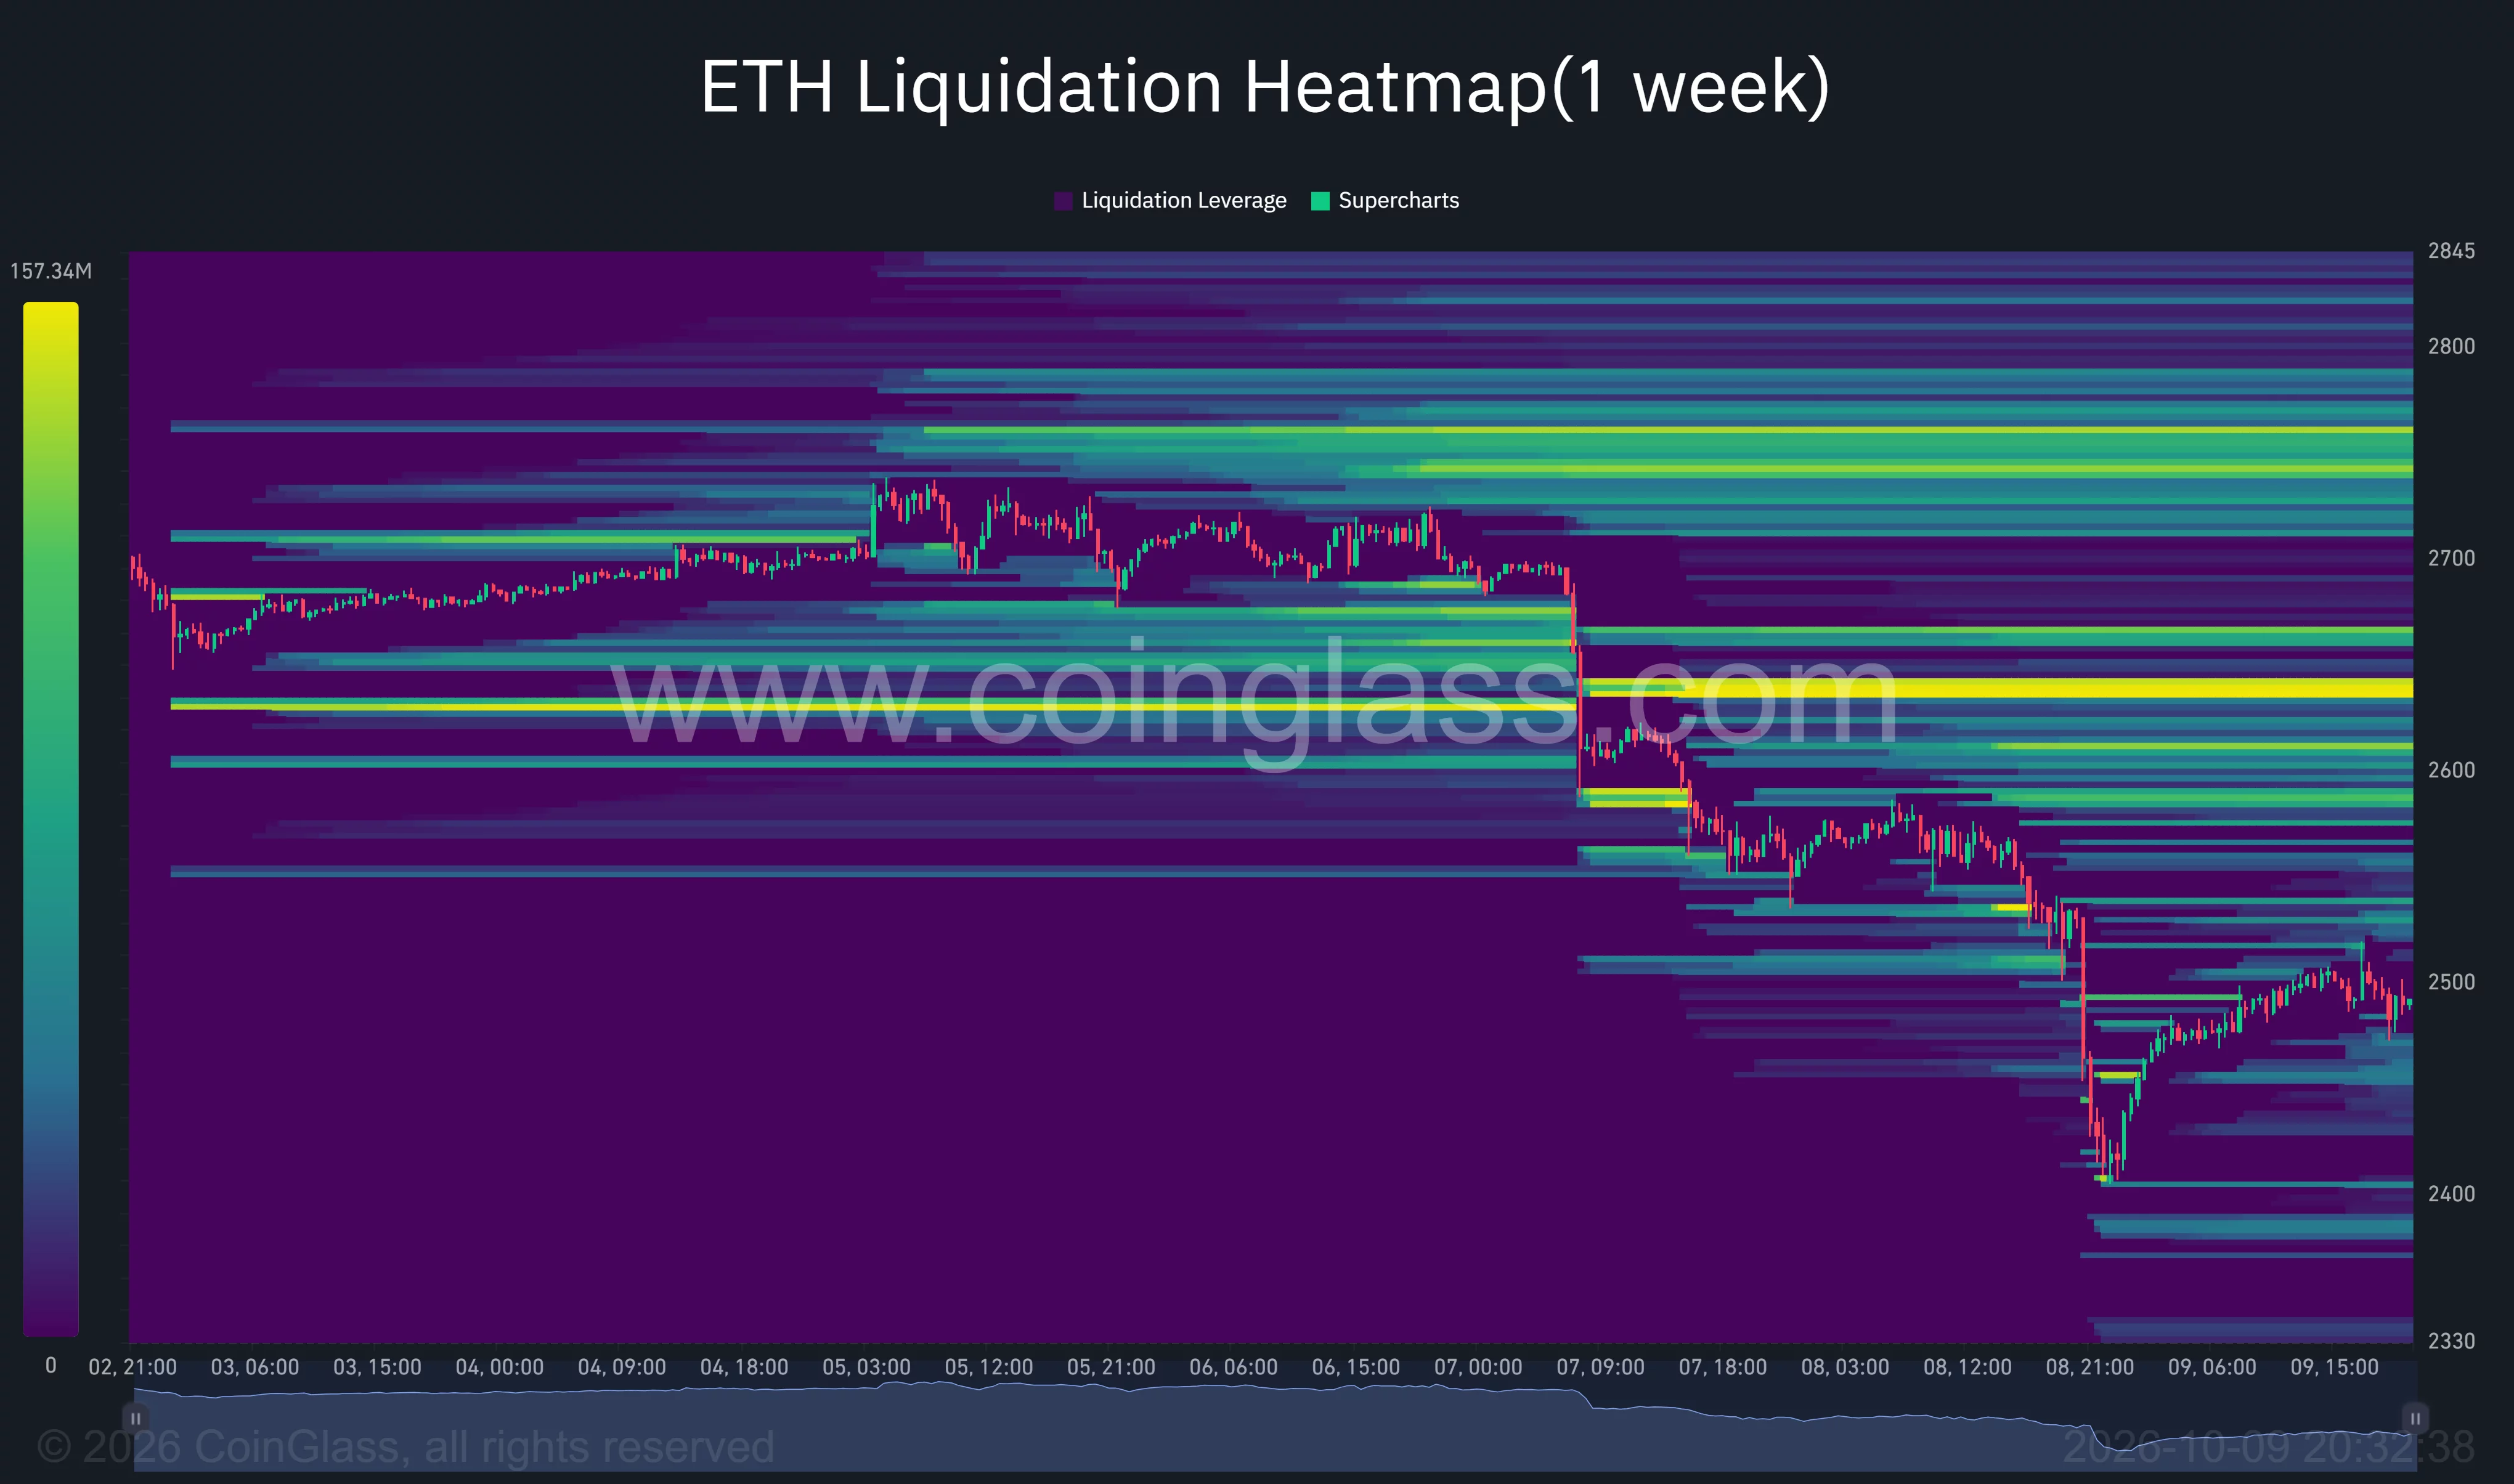
CoinGlass’s one-week Ethereum liquidation heatmap showed its brightest remaining overhead concentration around $2,635–$2,640. Additional bands appeared near $2,610 and across approximately $2,740–$2,760, above the current market price.
Ethereum liquidation heatmap | Source:
CoinGlass
Below ETH, the heatmap displayed smaller concentrations around $2,450–$2,460 and $2,400, with further bands near $2,380. Those levels sit beneath the rebound and around the area reached during the sharpest part of the decline.
A separate weekly assessment from the analyst publishing as Wealthmanager offered a longer-term bullish scenario. The analyst described an inverse head-and-shoulders setup, a reclaimed neckline and improving RSI, with a successful retest potentially opening a move toward $3,200–$4,000.
That forecast remains conditional on the weekly retest holding. On the shorter TradingView timeframes, Ethereum still faces $2,500 and $2,569 before the former trading range and daily Supertrend resistance near $2,764.
Disclosure: This article does not represent investment advice. The content and materials featured on this page are for educational purposes only.
Read more: Zcash price could reclaim $1,300 as selling pressure begins to ease