Ethereum is trading near an important price that could decide its next major price trend. After falling nearly 64% from its all-time high near $4,900 to current levels around $1,773, ETH has
Ethereum is trading near an important price that could decide its next major price trend. After falling nearly 64% from its all-time high near $4,900 to current levels around $1,773, ETH has entered a consolidation phase that appears to be building a foundation for a larger move.
However, the charts suggest Ethereum may still need one final push lower before any sustained recovery can begin.
Ethereum Price Today: How Did ETH Go From $4,900 to $1,780?
The drop in Ethereum happened through multiple distinct phases rather than a single continuous selloff. The first major breakdown happened after ETH failed to hold above $4,000. This ended the previous bull market structure and established a new downward move.
Once support at $3,500-$3,600 gave way, sellers took control and the market formed a series of lower highs and lower lows. The decline ramped up following the loss of the $3,000 psychological level.
Selling pressure intensified around $2,500-$2,600 and caused a sharp liquidation event that pushed Ethereum below $2,000.
The current price action no longer resembles a panic selloff. Instead, it looks like an extended accumulation phase following a completed macro downtrend.
Ethereum Chart Analysis: The One Level That Must Hold Before Any Recovery
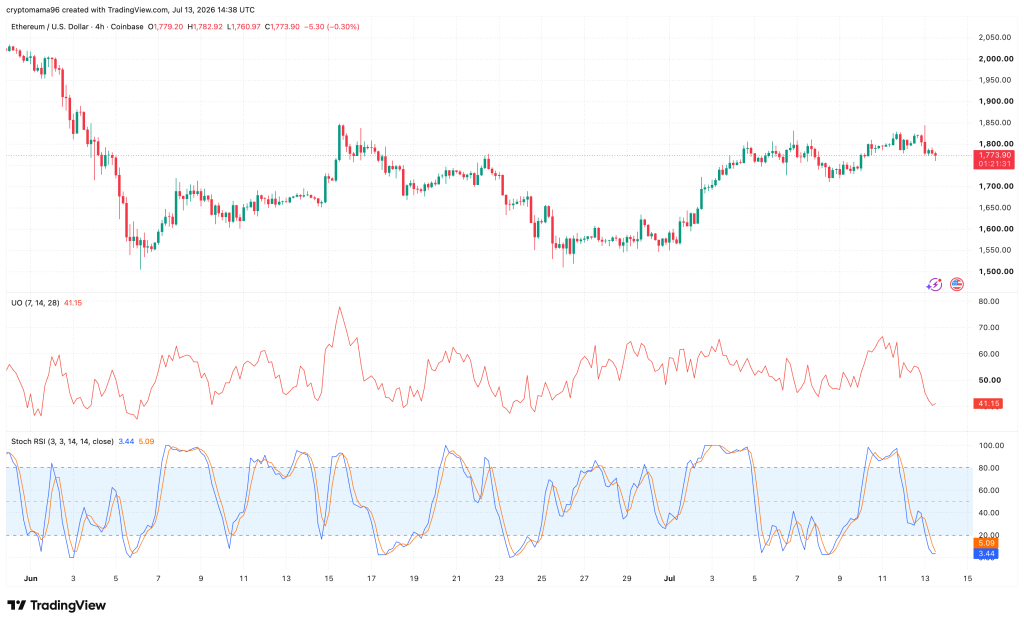
The $1,700-$1,720 support zone is the most important level on the chart right now. This area has repeatedly acted as both resistance and support throughout the recent consolidation.
This level matters for several technical reasons. It sits near the midpoint of the current multi-month trading range and aligns with a high-volume consolidation area where buyers previously stepped in.
The daily chart continues to defend this region despite multiple tests, and the recent recovery toward $1,850 originated directly from this support.
Source: TradingView
The 4-hour chart shows its importance. Ethereum recently failed to hold above $1,820-$1,840 and produced a lower high before pulling back toward support.
Momentum indicators confirm the cooling trend, with the Ultimate Oscillator falling to around 41 and the 4-hour Stochastic RSI resetting into oversold territory. These readings suggest short-term selling may already be becoming exhausted.
If $1,700 fails decisively on high volume, the technical structure changes considerably. The next downside targets would become $1,620, then $1,550.
Why One More Dip Is Actually Healthy
Ironically, another drop could improve Ethereum’s longer-term outlook rather than weaken it. The daily chart shows momentum cooling after several weeks of recovery from June lows.
From a technical perspective, one final flush would serve multiple purposes. It would remove weak late buyers who entered during the recent recovery.
This would trigger remaining stop-loss clusters beneath recent lows, reset momentum indicators that have become overheated, and create a higher-probability higher low if buyers quickly reclaim support.
The daily Ultimate Oscillator has already rolled over from above 60 toward the mid-40s, while the 4-hour Stochastic RSI sits back in oversold territory.
Read also: Zcash (ZEC) Surges, NEAR Protocol Could Be Next: Why This Analyst Is Waiting Before Buying
Ethereum Price Prediction: Where Does ETH Go After the Final Flush?
The charts currently favour a range-bound market that is preparing for its next directional move. The bullish scenario needs $1,700 to continue holding while momentum turns higher.
Initial resistance sits at $1,820-$1,850, with a confirmed breakout above that level opening the path toward $1,950-$2,000.
Reclaiming $2,000 would invalidate the recent sequence of lower highs and improve Ethereum’s medium-term technical outlook.
Above $2,000, the next major resistance comes around $2,200-$2,300, where previous daily congestion exists.
Confirmation would come from higher lows on the 4-hour chart, Stochastic RSI crossing back upward from oversold, the Ultimate Oscillator moving above 50, and strong volume accompanying a breakout above $1,850.
The bearish scenario comes into play if ETH closes decisively below $1,700. The market would likely extend toward $1,620, then $1,550, with $1,500 becoming the next major accumulation zone.
If buyers successfully defend $1,700 and reclaim $1,850, the current correction could ultimately prove to be the final shakeout before Ethereum begins building toward the $2,000-$2,300 region.
Frequently Asked Questions
Will ETH dip back down
Yes, another pullback is possible. Ethereum is still trading below major resistance levels, and price swings remain common. Holding support is important for any sustained recovery.
Will Ethereum go down in 2026Ethereum could see more downside if market sentiment weakens or key support levels fail. At the same time, ETF demand, network upgrades, and staking activity could support a recovery later in the year.
Is now a good time to buy ETHThat depends on your investment goals and risk tolerance. Long-term investors often buy during market weakness, while short-term traders may wait for a confirmed breakout.
Subscribe to our YouTube channel for daily crypto updates, market insights, and expert analysis.
The post Ethereum Price Has One More Dip Before Its Next Big Move – Here’s the Level appeared first on CaptainAltcoin.