Ethereum price prediction models are getting a lot of attention this week. ETH traded near $2,657 on September 28, down 1.28% over the past 24 hours. The coin is holding close to $2,650, and
Ethereum price prediction models are getting a lot of attention this week. ETH traded near $2,657 on September 28, down 1.28% over the past 24 hours. The coin is holding close to $2,650, and $2,800 is the next level traders are watching.
Whales are buying. But a heavy supply zone sits just above the current price.
What Is the Ethereum Price Today?
Ethereum is trading at around $2,657. That is a drop of about $34 in the last 24 hours, and it shapes any Ethereum price prediction right now.
Here is a quick look at the market data.
Metric
Value
Price
$2,657
24h Change
-1.28%
Market Cap
$324.57B
Circulating Supply
122.08M ETH
Futures Volume (24h)
$27.94B
Spot Volume (24h)
$2.06B
Open Interest
$34.01B
The market cap sits at $324.57 billion. Futures trading is far bigger than spot trading, which shows how active derivatives traders are right now.
Why Is Ethereum Going Up or Down Today? Ethereum News Today
Derivatives activity jumped. Trading volume rose 49.72% to $27.95 billion. Options volume climbed 54.24% to $730.10 million.
Open interest stayed almost flat at $34.02 billion, up just 0.06%. So traders are active, but they are not piling on new leverage.
Options open interest sits at $5.41 billion, up 0.90%.
Most ETH news today points to one theme. Big buyers are active, but price keeps stalling near $2,800.
Are Traders Long or Short on Ethereum?
More traders are betting on higher prices. The long/short ratios on major exchanges are above 1.
Exchange / Group
Long/Short Ratio
ETH 24h Long/Short
0.9384
Binance ETH/USDT (Accounts)
2.7679
OKX ETH (Accounts)
1.53
Binance Top Traders (Accounts)
1.6096
Binance Top Traders (Positions)
1.6051
The overall 24-hour ratio is 0.9384, which is slightly below 1. But the account and top trader ratios lean long.
Top traders on Binance hold more long positions than short ones. That points to a bullish lean among bigger players.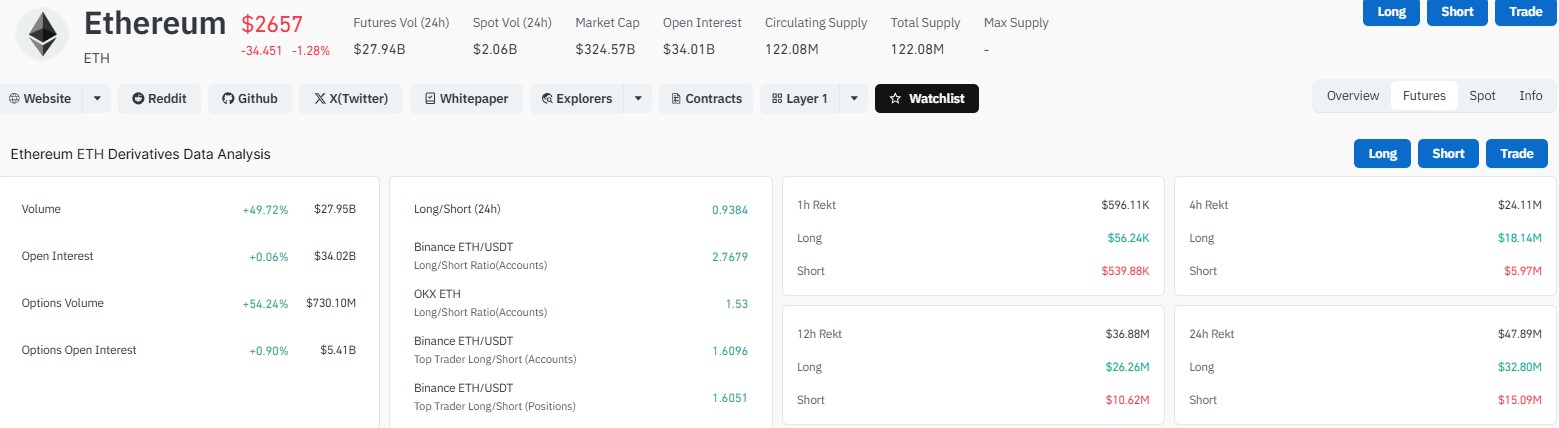
How Much Ethereum Was Liquidated in 24 Hours?
Total liquidations reached $47.89 million over 24 hours. Longs took the bigger hit.
Period
Total Liquidated
Longs
Shorts
1 hour
$596.11K
$56.24K
$539.88K
4 hours
$24.11M
$18.14M
$5.97M
12 hours
$36.88M
$26.26M
$10.62M
24 hours
$47.89M
$32.80M
$15.09M
Over 24 hours, $32.80 million in longs were wiped out against $15.09 million in shorts. Leveraged buyers felt more pain.
In the last hour, the story flipped. Shorts lost $539.88K while longs lost only $56.24K.
Are Ethereum Whales Buying? Latest Ethereum Eth News
Yes, and the numbers are large. According to analyst Ali Charts, transactions worth over $1 million surged nearly 500% in a week. They rose from 1,202 to 7,113, based on Santiment data.
The chart in his thread shows a peak of 7,184 on the latest day. That is the highest bar on the graph by a wide margin.
Large holders also added more than 320,000 coins over the past week. That is worth about $864 million at current prices.
Whale demand is rising. Still, buying alone does not guarantee a breakout.
What Is the Resistance Level for Ethereum?
The main problem is a supply wall between $2,722 and $2,822. More than 13.3 million ETH changed hands in this range before.
Many holders who bought there may sell when the price returns. That creates pressure.
The daily chart also marks $2,807 as a major line. The altcoin pushed close to it recently and pulled back.
Ali points out that failed attempts would be normal here. Once it clears the zone, the next hurdles near $2,970 and $3,366 look smaller.
What Are the Support Levels for Ethereum?
ETH is trading above the rising 20-day average near $2,602. That keeps the short-term structure positive.
Further down, the 50-day average sits near $2,426. The 100-day and 200-day averages are close together at $2,265 and $2,259.
These lines are bunching up around $2,260. That makes it a strong area to watch if price falls.
A blue horizontal line at $2,149 marks the next floor. Under it, a rising trendline runs near $1,500 to $1,550, drawn from the June lows.
Ethereum Price Prediction: Key Levels to Watch
The chart offers a clear map for this Ethereum price prediction. Here are the levels that matter most.
Level
Type
Note
$3,366
Resistance
Later hurdle after breakout
$2,970
Resistance
Next hurdle above the wall
$2,807
Resistance
Major daily chart line
$2,722 to $2,822
Supply zone
13.3M ETH traded here
$2,602
Support
Rising 20-day average
$2,550 to $2,560
Support
Prior breakout area
$2,426
Support
50-day average
$2,265 to $2,259
Support
100-day and 200-day averages
$2,149
Support
Horizontal floor
The daily RSI reads about 62. That is firm, but not overheated.
Will Ethereum Go Up? ETH Price Prediction (Bullish Case)
ETH broke out of a 2,400 to 2,550 range earlier this month. A strong bullish 4H candle followed.
On the 4-hour chart, Ali notes a break above $2,560, a retest, and a push toward $2,637. He watches $2,760 as the next short-term target.
If buyers hold $2,600 to $2,550 and regain speed, a clean move above $2,807 could open the way toward $2,900 to $3,000.
On the weekly view, ETH left a multi-week box. If that holds, some chart watchers see room toward $3,200 to $3,600. A weekly close above $2,800 could push price toward $3,400.
These are possible paths, not promises.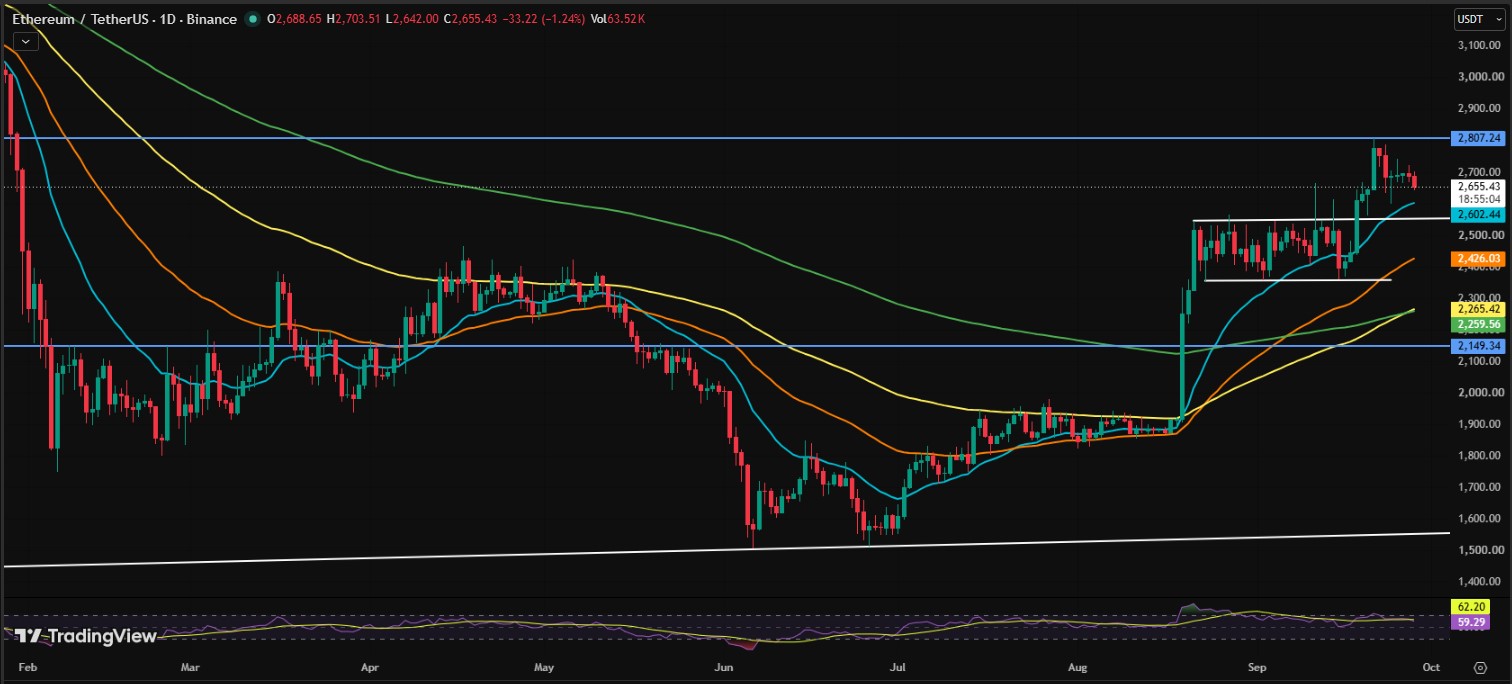
Will Ethereum Fall? ETH Price Forecast (Bearish Case)
The risk is a rejection at the resistance zone. Smaller candles after the big move show some profit-taking.
If ETH closes a 4H or daily candle below the rising average near $2,602, a deeper pullback could start. The first target would be $2,426.
Below that, traders would look at $2,260 and $2,150 as support areas. Falling under $2,550 would also weaken the breakout story.
What Should Ethereum Traders Watch Next?
Three things matter most in the coming days.
Whether ETH can close above $2,807 with strong volume
Whether $2,600 holds on any dip
Whether whale buying continues or slows
This Ethereum price forecast stays bullish while the price holds above $2,600. But a confirmed break above $2,807 would give the trend more weight.
The Ethereum price outlook is mixed. Demand looks strong, yet the ceiling above is thick.
Disclaimer
This article is for information only. It is not financial, investment, or trading advice. Cryptocurrency prices are highly volatile, and you can lose money. Price levels and targets mentioned here are opinions from chart analysis, not guarantees. Always do your own research and speak with a licensed financial advisor before making any investment decision.