Ethereum trades near $2,708 as of 09:00 UTC on September 27, 2026, up close to one percent on the day. The broader move over seven days sits near three percent higher, and the trend has turne
Ethereum trades near $2,708 as of 09:00 UTC on September 27, 2026, up close to one percent on the day. The broader move over seven days sits near three percent higher, and the trend has turned constructive after months inside a falling channel. Immediate support sits at the $2,346 zone, and the first real resistance cluster sits close to $2,900.
The near-term target many traders are watching lines up with the ethereum price prediction hub, where $3,600 and $4,000 both show up as key markers. The main catalyst right now is ETF buying. The main risk is a stall right under resistance. That tension is the whole story.
Ethereum Price Prediction Today
Trading near $2,708, Ethereum is up roughly 0.85% over 24 hours and about 2.87% over seven days, according to CoinMarketCap. Market cap stands at $330.4 billion, with 24-hour volume near $5.46 billion. Daily RSI reads 64.76, firmly bullish without being overbought. The relationship with Bitcoin stays tight; ETH still moves in step with BTC on most sessions, and that correlation matters for anything said below.
$ETH Price Prediction at a Glance
Metric
Current Reading
Current Price
$2,708 (09:00 UTC, Sep 27, 2026)
Trend
Bullish
Immediate Resistance
$2,900
Major Resistance
$4,029
Immediate Support
$2,346
Major Support
$1,510
RSI (Daily)
64.76
Next Target
3,600–4,000
Invalidation
Below $2,346
$ETH Technical Analysis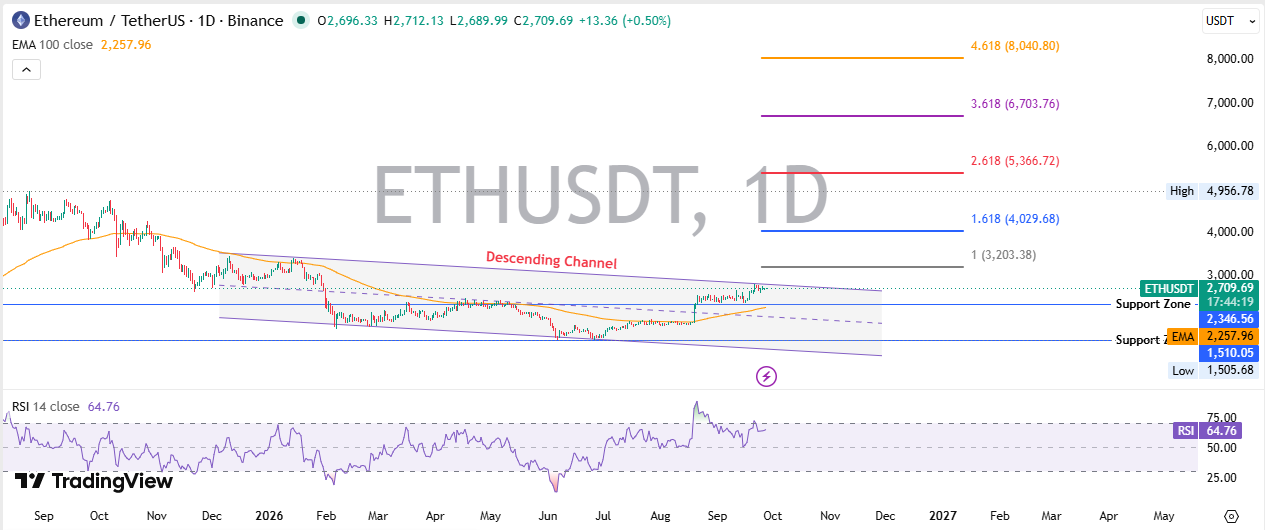
ETH Trend Structure
Ethereum built a series of higher lows through 2026 inside a descending channel, and price finally pushed against the upper boundary this week. Daily structure looks bullish. The weekly structure is still being repaired. It's the kind of setup that follows a squeeze, and it did, one already covered in the piece on therecent short squeeze rally.
$ETH Support Levels
First support sits at $2,346, a zone that's held on multiple retests. Major support stretches down near $1,510, matching the 2026 low. A close under $2,346 with real volume would flip the near-term picture bearish.
$ETH Resistance Levels
Immediate resistance clusters near $2,900, right at the top of the descending channel structure. Major resistance lines up with the 1.618 Fibonacci extension at $4,029. A confirmed breakout needs trading to hold above channel resistance for more than one session.
RSI and Momentum
RSI at 64.76 confirms the current push rather than fighting it. It's not flashing exhaustion yet. But momentum indicators lag price, and that's worth remembering before chasing a single green candle.
MACD and Trend Confirmation
The MACD line sits above its signal line, with a small but positive histogram. That's a mild bullish crossover, not a fireworks show. Momentum is building slowly. Turns out, slow and steady breakouts tend to hold better than vertical spikes.
Trading Volume
Spot volume near $5.46 billion supports the move, though it isn't extreme. A real breakout above $2,900 would need volume to expand further. Without it, the rally risks fading into another range.
$ETH Price Prediction Scenarios
Bull Case
A confirmed close above $2,900 with rising volume opens the door toward $3,600 to $4,000, a range that implies a market cap near $439 billion to $488 billion. Catalysts include the ongoing ETF inflow streak tracked by theETF flow dashboard and a tightening staking queue. This case fails if the price gets rejected twice at $2,900 and the volume dries up.
Base Case
Most likely, $ETH chops between $2,500 and $2,900, putting the market cap near $305 billion to $354 billion, while the market digests recent gains, a pattern similar to the one behind therecent multi-coin rally. Support and resistance stay at $2,346 and $2,900. Invalidation comes from a decisive break of either edge.
Bear Case
A breakdown under $2,346 exposes $1,510 to $1,900, or roughly $184 billion to $232 billion in market cap. The trigger would be ETF outflows or a sharp Bitcoin slide. Reclaiming $2,700 with conviction would invalidate this case fast.
Ethereum Price Prediction for 2026
Scenario
Price Range
Est. Market Cap
Conditions
Bear
$1,500–$2,300
183B–281B
ETF outflows, macro tightening
Base
$2,600–$3,600
317B–439B
Range-bound, steady ETF demand
Bull
$3,600–$5,300
439B–647B
Breakout + sustained inflows
None of this is guaranteed. It's a range exercise, not a prophecy. Market cap figures above use current circulating supply, near 122 million ETH, held roughly constant.
Ethereum Price Prediction 2027
Longer term, the case rests on adoption, continued ETF flows, network activity, and staking behavior, alongside the pace ofdecentralized finance activity on the base layer. Layer-2 economics, macro liquidity, and the broader Bitcoin cycle all feed into it too.
Positioning data fromtrader positioning data shows crowded long bets right now, which cuts both ways for 2027 setups. A precise number for next year isn't something anyone can calculate honestly today, but a working range looks like this:
Scenario
Price Range
Est. Market Cap
Conditions
Bear
$1,800–$2,600
223B–322B
Weak adoption, tighter liquidity
Base
$3,000–$4,200
372B–521B
Steady ETF and staking demand
Bull
$4,200–$6,200
521B–769B
Strong adoption, L2 growth, BTC strength
Ethereum Price Prediction 2028
By 2028, network maturity and Layer-2 settlement volume should carry more weight than short-term momentum. Assuming a circulating supply near 124 million ETH, the ranges below hold up as a reasonable working model, not a promise.
Scenario
Price Range
Est. Market Cap
Conditions
Bear
$2,000–$3,000
248B–372B
Regulatory friction, weak flows
Base
$3,400–$4,800
422B–595B
Continued institutional accumulation
Bull
$4,800–$7,200
595B–893B
Broad tokenization and RWA growth
Ethereum Price Prediction 2029
Heading into 2029, the bigger swing factor is whether staking absorbs a larger share of supply while stablecoin and RWA settlement keep growing on-chain. Using the same 124 million ETH supply assumption:
Scenario
Price Range
Est. Market Cap
Conditions
Bear
$2,200–$3,400
273B–422B
Macro stress, ETF outflows
Base
$3,800–$5,400
471B–670B
Steady demand, moderate BTC cycle
Bull
$5,400–$8,200
670B–1.02T
New all-time highs, deep institutional bid
Ethereum Price Prediction 2030
Conservative models put $ETH near $3,000 to $6,000 by 2030, implying a market cap near $375 billion to $750 billion on an assumed supply of roughly 125 million ETH. Base-case estimates run $6,000 to $10,000, or close to $750 billion to $1.25 trillion.
Aggressive scenarios stretch past $10,000 to $15,000, near $1.25 trillion to $1.88 trillion, tied to heavy institutional adoption and network growth. Independent research trackers show just how wide institutional targets can spread, from cautious single-digit-thousand calls to far more aggressive long-run cases. None of these figures should be copied and treated as fact.
What Could Drive Ethereum Higher?
ETF and Institutional Demand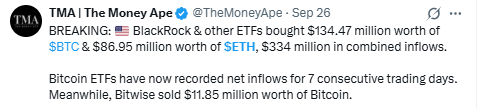
Spot ETF buying stayed strong into late September, withfresh ETF inflow data showing over $86 million added in a single day.
Ethereum Network Activity
On-chain transaction data shows steady throughput, with median gas near 0.057 Gwei and roughly 15.5 transactions per second network-wide.
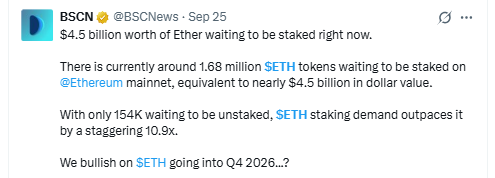
Staking queue figures show 1.68 million ETH waiting to be staked versus only 154,000 waiting to exit, a ten-times demand imbalance.
$ETH Upgrades
Ongoing scaling upgrades keep pushing more activity onto Layer-2 networks, cutting costs while still settling value back to the base chain.
What Could Push Ethereum Lower?
Macro Liquidity
Tighter global liquidity conditions hit risk assets first, and crypto sits near the top of that list.
ETF Outflows
A reversal in daily ETF flows would remove one of the clearest tailwinds behind the current bid.
ETH/BTC Weakness
If $ETH keeps losing ground against Bitcoin on the ETH/BTC pair, dollar-price gains get harder to hold.
Lower Fee Capture
Falling fee revenue, visible throughgas fee tracking data, would weigh on the network's value story.
Regulatory Risks
New restrictions on staking, custody, or ETF structures anywhere in a major market could rattle sentiment fast.
Loss of Major Support
A daily close under $1,510 would break the multi-year floor and open a much deeper decline.
Will $ETH Reach $4,000?
It's possible before year-end if the current breakout holds above $2,900 with volume behind it. That target already got attention in thebreakout rally coverage and lines up with the 1.618 extension near $4,029, a level that would put the market cap near $488 billion. Is the setup there right now? Close, but not confirmed.
Will Ethereum Reach $5,000?
That level sits near the prior all-time high of $4,953.73 and would carry a market cap near $610 billion. Reaching it needs the $4,000 zone cleared first, plus fresh catalysts beyond current ETF demand.
Will $ETH Reach $10,000?
Only in an aggressive multi-year scenario built on deep institutional adoption, heavy staking lockup, and a strong Bitcoin cycle, one that would push market cap past $1.2 trillion. Short-term, it's not on the table. And it shouldn't be treated like it is.
$ETH Price Prediction Risks
Market risk covers ordinary volatility swings tied to sentiment shifts. Liquidity risk shows up when thin order books amplify moves during low-volume hours. Regulatory risk stays elevated given ongoing global policy debate over staking and custody. Technical breakdown risk means a clean loss of $2,346 or $1,510 support.
Bitcoin correlation means Ethereum rarely moves independently for long. Forecast and model risk applies to every range in this piece; models assume conditions that can change overnight. Basic account hygiene, includingsecure wallet storage habits, matters more during volatile stretches, not less.
Breaking: ETF Desks Keep Buying
Fresh data lands. BlackRock's spot ETH fund keeps leading inflows. $86.95 million moved in on a single day. Combined with Bitcoin ETF buying, total inflows hit $334 million in 24 hours. Bitcoin ETFs just closed a seventh straight day of net buying. One outlier: Bitwise sold $11.85 million in Bitcoin the same day. Desks are not walking away from this trade. Not yet, anyway.
More Ethereum Coverage
Readers tracking the wider market can check thelatest ethereum news coverage for updates beyond this prediction and background onrecent multi-coin price moves in recent sessions.
Disclaimer
This content is for informational purposes only and does not constitute financial, investment, or trading advice. Cryptocurrency markets are highly volatile, and price predictions carry significant uncertainty. Independent research and consultation with a licensed financial advisor is recommended before making any investment decisions.