Ethereum is trading near $1,800 this week, and the setup behind that price is worth watching. Spot ETH ETFs are on pace for their first week of net inflows since May, snapping a two-month run
Ethereum is trading near $1,800 this week, and the setup behind that price is worth watching.
Spot ETH ETFs are on pace for their first week of net inflows since May, snapping a two-month run of outflows.
That improving demand is showing up just as ETH pushes into a tough resistance zone between $1,900 and $2,000. The next few sessions could decide which way this breaks.
Let's discuss the Ethereum Price Prediction.
Are ETH ETFs about to snap their losing streak?
As per the BSCN tweet, Spot Ethereum ETFs lost more than $52 million on July 9. Even so, the group is still up $66 million for the week.
That is a big deal. These funds have not seen a full week of inflows since early May. Two straight months of outflows have weighed on sentiment.
If the funds hold onto that $66 million cushion through July 10, the streak breaks. Traders are watching closely, since ETF flows often hint at where bigger money is leaning.
A positive week would not fix everything. But it could give ETH's price action a much-needed shot of confidence.
Where does ETH stand right now? A quick price forecast check
Ethereum has bounced back this week. ETH is trading around $1795 at the time of writing, up 0.95% over the past 24 hours.
Prices moved from below $1,750 up toward the $1,790 to $1,800 zone, gaining roughly 2.57% over the past seven days. This bounce is central to the ETH price prediction for the coming days.
That is a real recovery from June's steep slide, when the altcoin dropped from above $2,500 toward the $1,500 area.
Still, the bigger picture has not changed much. ETH remains far below its 2025 highs, and the rally so far looks more like a bounce than a breakout.
Is this a double top or a double bottom?
Chart watchers are split on what comes next. Two patterns are forming at the same time, and only one will win out.
Pattern
Price Zone
What It Means
Double Top
Near $1,800–$1,850
Could signal more downside if resistance holds
Double Bottom
Near $1,500–$1,550
Could signal a floor and a fresh push higher
Right now, ETH is holding above $1,750. That level matters a lot for the Ethereum price prediction outlook this week. Staying above it keeps the relief rally alive. Dropping back under it would put the double top scenario back on the table.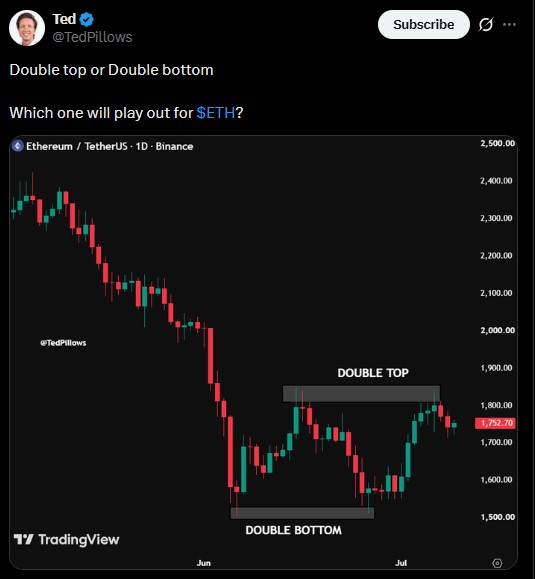
What are the key levels to watch in the Ethereum outlook?
Ethereum is approaching a major daily bearish order block and fair value gap between $1,900 and $2,000. This is a zone where sellers have stepped in before, and it could happen again.
Here is how traders are framing the setup:
Bullish above $2,150, seen as a major higher-timeframe breakout
Bearish below $2,050 until proven otherwise
A loss of $1,730 raises the odds of a retest toward $1,500
This looks more like a relief rally into higher-timeframe supply than a confirmed trend reversal. The next move through resistance, or a rejection from it, could set the tone for weeks.
Why does trader leverage matter here?
There is a quieter shift happening beneath the price chart. Binance's ETH estimated leverage ratio has fallen 37.4% so far this year, dropping from 0.99 to 0.62.
That means fewer traders are using high leverage right now. Lower leverage usually means lower liquidation risk and a more stable market structure overall.
This does not mean the outlook is bearish. It often means the opposite. Markets sometimes make their strongest moves after leverage gets flushed out and traders reset their positions.
Right now, it looks like the market is simply waiting. Traders want a clear catalyst, whether that is confirmed ETF inflows, a break of $2,150, or a slip below $1,730, before committing to a direction.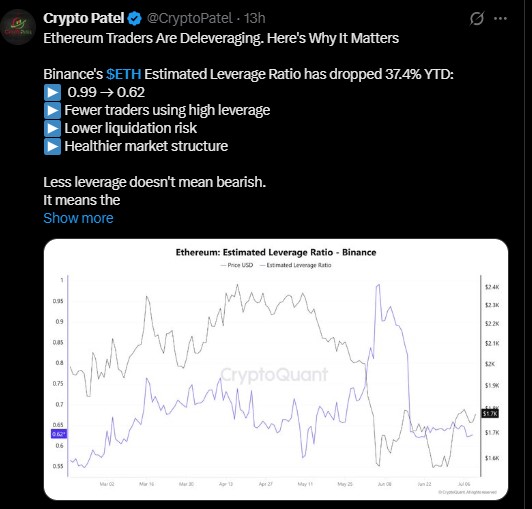
Ethereum Price Prediction Table
Scenario
Target
Probability
Bullish
$2,150
Medium
Neutral
$1,750–$1,900
High
Bearish
$1,500
Medium
The bottom line
Ethereum price Forecast: If ETF inflows remain positive and ETH breaks above $1,900, buyers could target $2,150 in the coming weeks.
However, losing $1,730 may trigger another move toward $1,500. Until a breakout occurs, traders should expect range-bound trading.
Disclaimer
This article is for informational purposes only and does not constitute financial, investment, or trading advice. Cryptocurrency markets are highly volatile and carry significant risk of loss. Always do your own research and consult a licensed financial advisor before making investment decisions.