Ethereum is changing hands around $1,910.67, up 2.24% on the day. The token has gained nearly $42 in the last 24 hours, according to trading data. Trading volume jumped 31.15% to $35.67 billi
Ethereum is changing hands around $1,910.67, up 2.24% on the day. The token has gained nearly $42 in the last 24 hours, according to trading data.
Trading volume jumped 31.15% to $35.67 billion. Open interest also rose 1.39% to $26.65 billion, showing more traders are placing bets on ETH's next move.
The Ethereum price prediction picture right now is mixed. Some charts point to a big rally ahead. But short-term data shows heavy liquidations on both sides.
What do the ETH liquidation numbers show?
Liquidation data tells a story of a shaky, two-sided market. In the last hour, longs lost $51.25K while shorts lost $12.15K.
Over 24 hours, the picture flipped hard. Long positions lost $8.96M, while short sellers lost a much bigger $39.93M.
This means traders betting against $ETH got hurt more than those betting on it over the full day. The Binance long/short ratio sits at 1.99, meaning almost twice as many accounts are long as short.
Is $ETH ETF inflow data bullish right now?
Spot ETH ETFs are pulling in fresh cash. Weekly data shows an inflow of $103.19 million for the week of August 5, 2026.
That follows several straight weeks of green numbers. Over the last five weeks, net inflows added up to $424.37 million.
Cumulative total net inflow into Ethereum ETFs has now crossed $11.31 billion, with total net assets sitting at $10.61 billion. This steady stream of ETF demand adds a layer of support under the Ethereum price prediction outlook.
BlackRock played a big part here too. The asset manager, which oversees more than $15 trillion, added $50.34 million worth of ETH through its ETHA fund. It also bought $198 million worth of Bitcoin the same day.
Are Ethereum whales buying or selling?
On-chain data shows large holders are still stacking ETH. One OTC whale wallet, tagged 0x8c58, bought another 10,000 ETH worth $19.1 million.
That same wallet had already bought 27,000 coins worth $52.03 million two weeks earlier. Together, that is over $71 million in ETH bought by a single wallet in a short window.
Not all wallet activity was pure buying, though. The Ethereum Foundation grant wallet moved 578.38 coins, worth about $1.08 million, to a new Gnosis Safe Proxy wallet. It also sent 2.675 ETH to Kraken, a much smaller amount worth around $5,070.
Foundation wallet transfers to exchanges sometimes raise eyebrows among traders, since exchange deposits can hint at future selling. But the amount here is tiny compared to the whale buying seen elsewhere.
Ethereum price prediction: What do the charts say?
A widely shared ETH/USDT daily chart lays out a longer-term bullish path. The chart shows Ethereum trading inside a broad structure marked by higher highs and higher lows since 2023.
The current price sits near $1,916, based on the chart. Two scenarios are drawn out from here.
In one path, ETH could first dip toward the $1,550 to $1,600 zone before turning higher. In the more direct path, price pushes up toward $4,076 and then $7,093 as resistance zones.
The chart's boldest target sits far out, near $13,227, marked on the far right of the pattern as a longer-term projection. This is not a guaranteed outcome, just one technical scenario drawn from wave structure on the chart.
Support on the chart lines up near $1,550, an area tested multiple times over the past two years. A break below that zone would likely delay any push toward the higher targets.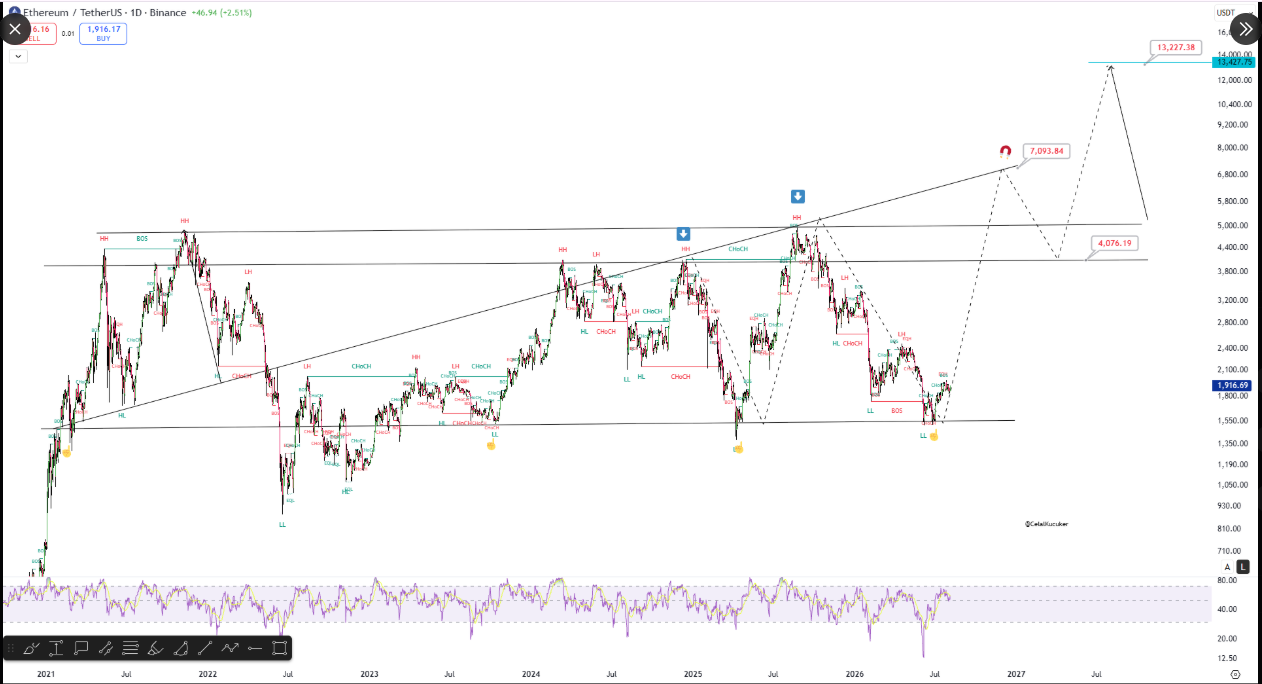
Ethereum price prediction summary table
Metric
Value
ETH Price
$1,910.67
24h Change
+2.24%
Market Cap
$230.18B
24h Volume
$35.67B
Open Interest
$26.65B
Weekly ETF Inflow
$103.19M
5-Week ETF Inflow
$424.37M
Cumulative ETF Inflow
$11.31B
Chart Support
~$1,550
Chart Resistance Targets
$4,076 / $7,093 / $13,227
What could move $ETH price next?
Three forces stand out right now. ETF inflows keep adding steady demand from institutional buyers.
Whale wallets are actively accumulating, with tens of millions of dollars in ETH bought in recent weeks. That kind of buying can act as a floor under price during dips.
At the same time, the long/short ratio near 2.0 shows the market is leaning bullish, which sometimes sets up short-term pullbacks as over-leveraged longs get squeezed.
Traders watching the Ethereum price prediction space will likely keep an eye on the $1,550 support zone and the $4,000 resistance area as the next key markers.
Disclaimer: This article is for informational purposes only and does not constitute financial, investment, or trading advice. Cryptocurrency markets are highly volatile and risky. Always do your own research and consult a licensed financial advisor before making any investment decisions.