Ethereum is trading near $1,830 this week, down sharply from its recent highs. The drop has left many traders asking if the bleeding is over. But a few analysts are pointing at old chart patt
Ethereum is trading near $1,830 this week, down sharply from its recent highs. The drop has left many traders asking if the bleeding is over.
But a few analysts are pointing at old chart patterns and wallet data that suggest the coin might be setting up for a bigger move.
Let’s discuss how long Ethereum can go.
What Is Ethereum's Price Today?
ETH is changing hands around $1,830, according to derivatives data pulled this week. That's a 4.68% drop in the past day alone.
The broader market cap for $ETH sits near $221 billion. Daily futures volume is above $45 billion, showing traders are still active despite the fear in the market.
Why Did Ethereum Price Crash Recently?
Ethereum has fallen alongside the wider crypto market over the past few months. Recession worries and heavy selling from large holders added pressure.
Fear and Greed readings have dropped into "Fear" territory. That usually means selling has been aggressive and sentiment is weak.
Still, price and sentiment don't always move together for long.
ETH Reclaims the 0.8 MVRV Band: A Pattern That's Repeated for Six Years
Analyst Ali Charts pointed out something interesting this week. Ethereum has a habit of rallying hard every time it reclaims the 0.8 MVRV Pricing Band as support.
That pattern has played out for six years straight. Each time ETH holds this band, it tends to climb back toward its Realized Price.
Right now, that Realized Price sits close to $2,245. After briefly dipping under the 0.8 band, ETH climbed back above it this week.
The Third Bullish Engulfing Pattern of the Cycle Just Printed
Chart watchers have also flagged a weekly Bullish Engulfing candle, the third one to appear this cycle.
Setup
Result
1st Bullish Engulfing
+169% rally
2nd Bullish Engulfing
+253% rally
3rd Bullish Engulfing (current)
Projected toward $3,400+
That would be roughly 125% upside from current levels, though nothing is guaranteed. Past patterns don't always repeat the same way twice.
The setup does show a stronger trend structure and buyers stepping in at lower prices, according to the chart data.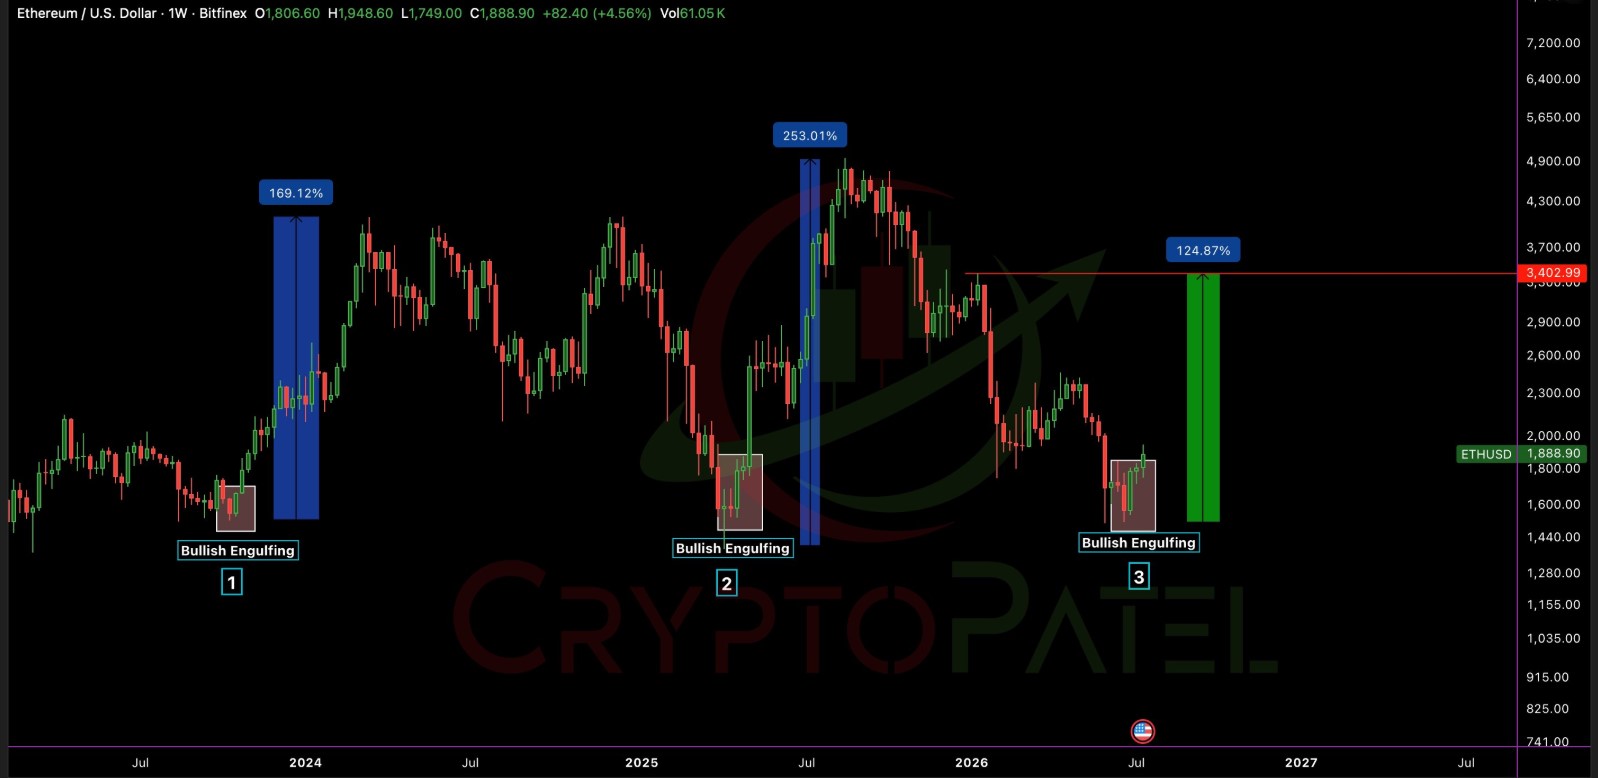
Big Wallets Are Buying the Dip, Not Selling It
On-chain data shows some heavyweight names accumulating rather than dumping.
Trader and Maelstrom founder Arthur Hayes reportedly bought 1,293 ETH, worth close to $2.48 million, according to blockchain tracker Lookonchain.
Separately, three newly created wallets pulled 30,000 ETH, worth about $57.66 million, off Coinbase Prime. Moving coins off exchanges like this is often read as a sign of long-term holding rather than plans to sell.
Staking Demand Points to Long-Term Confidence
Staking numbers are also worth watching. Right now, 2,675,221 ETH is lined up to be staked on the network.
Only 31,860 ETH is waiting to exit. That's a big gap, and it suggests many holders want their coins locked up rather than sold on the open market.
Ethereum Price Prediction: What's Next?
If Ethereum holds the 0.8 MVRV band and the recent weekly low stays intact, the setup analysts describe could point toward the $2,245 Realized Price first.
A move beyond that, if buying pressure holds, could open the door toward the $3,400 area flagged in recent chart analysis.
That said, Ethereum remains in a bearish daily trend by some technical readings, and a break below recent lows would likely delay any of these targets.
Disclaimer: This article is for informational purposes only and does not constitute financial advice. Cryptocurrency markets are highly volatile and unpredictable. Always do your own research and consult a licensed financial advisor before making any investment decisions.