Ethereum price rose nearly 2% on July 29 as US spot ETF inflows and short liquidations helped ETH defend its rising support structure before the Federal Reserve’s rate decision. Summary Ether
Ethereum price rose nearly 2% on July 29 as US spot ETF inflows and short liquidations helped ETH defend its rising support structure before the Federal Reserve’s rate decision.
Summary
- Ethereum recovered above $1,900 after rebounding from an intraday low near $1,856.
- US spot Ethereum ETFs attracted $14.53 million, including $5.15 million for Morgan Stanley’s MSSE.
- The 4-hour chart places ETH inside an ascending channel, with resistance approaching $1,970.
- Liquidation clusters near $1,940 and $1,960 could shape the next move before the Fed decision.
Ethereum price returns above $1,900
According to data from crypto.news, Ethereum (ETH) price was trading near $1,913 at the time of writing, up about 2% over the past 24 hours. The token had traded between approximately $1,856 and $1,926 during the session.
The recovery followed a successful defense of the $1,850–$1,880 region. ETH first reclaimed the daily Bollinger Band midpoint at $1,874 before moving back above the psychological $1,900 level.
Ethereum’s daily chart shows price consolidating between the Bollinger Band midpoint and upper boundary. The upper band sits at $1,973, making the $1,970–$2,000 region the next technical barrier. The lower band remains near $1,775.
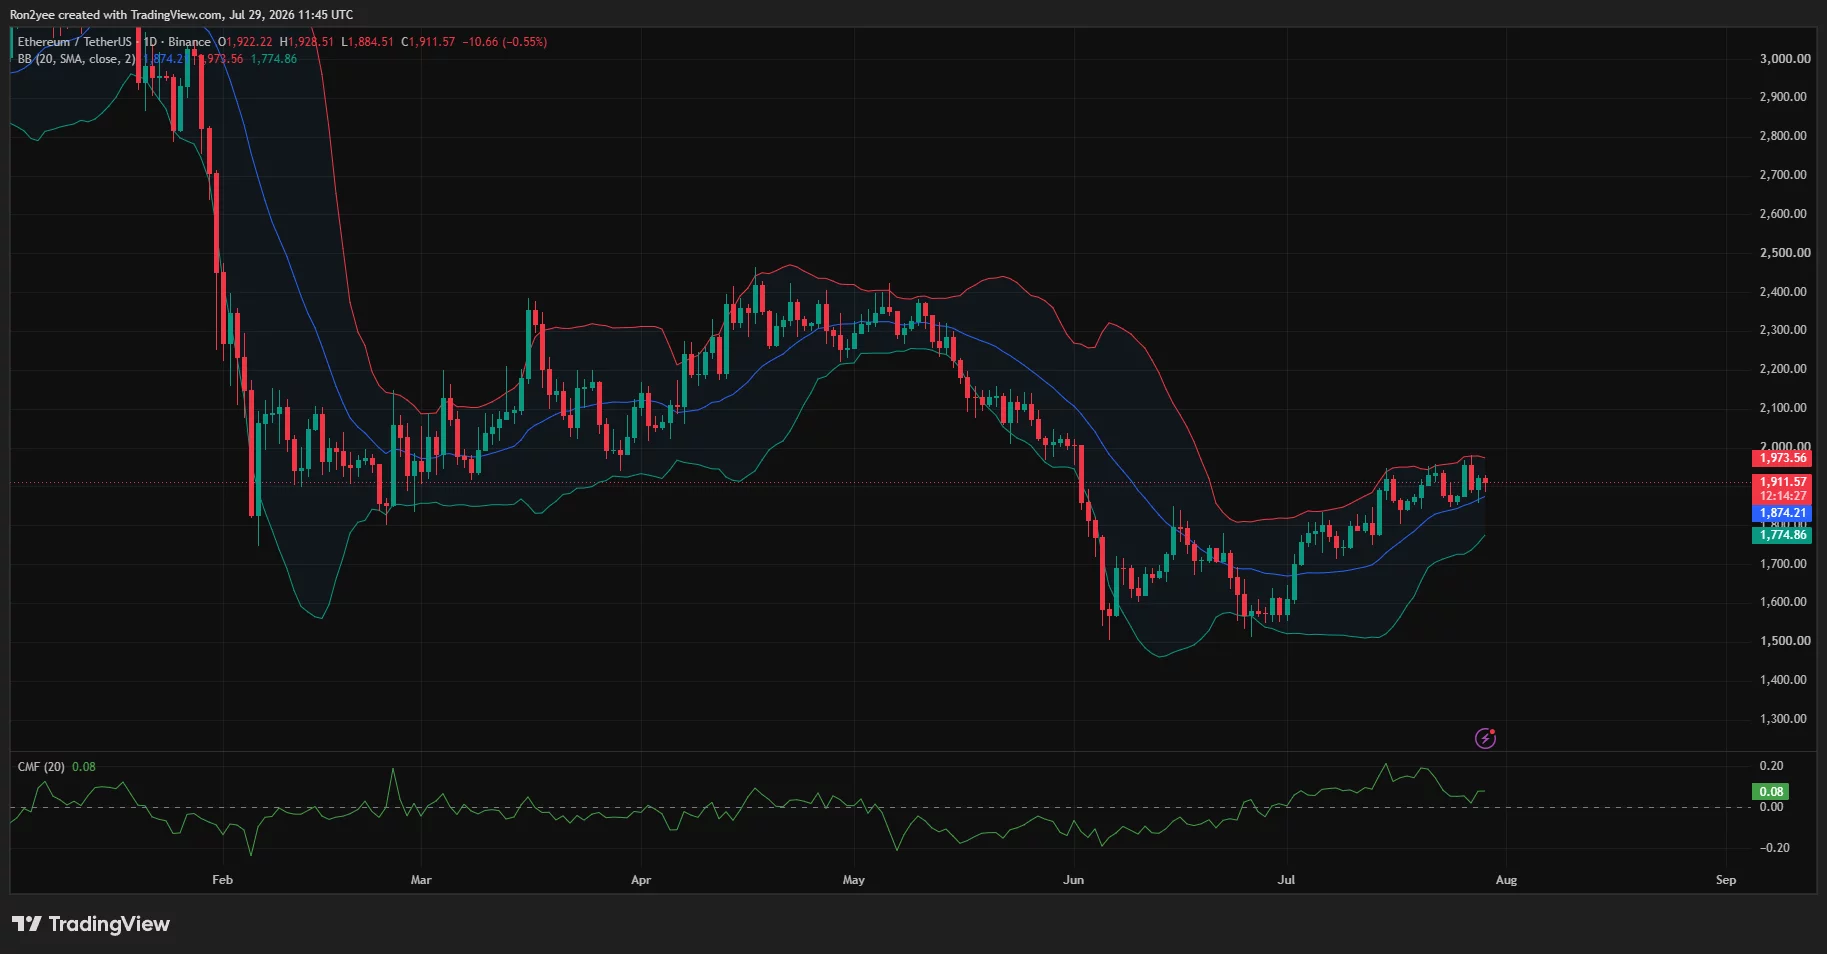
Ethereum price daily chart — July 29 | Source:
crypto.newsBuying pressure has also improved. The Chaikin Money Flow reading stands at 0.08, above the neutral line and indicating that capital inflows currently outweigh distribution. However, the indicator remains below its July high, suggesting demand has not yet reached breakout strength.
You might also like: Hungary scraps crypto validator checks to align with MiCA framework
Morgan Stanley ETF adds to institutional demand
The rally coincided with the first trading session for the Morgan Stanley Ethereum Trust, which listed on NYSE Arca under the ticker MSSE.
MSSE attracted $5.15 million in net inflows and generated $19.03 million in first-day trading volume. BlackRock’s ETHB recorded the largest daily inflow at $5.91 million, while combined spot Ethereum ETF inflows reached $14.53 million.
US-listed Ethereum funds held about $10.5 billion in net assets after the session, equal to 4.53% of Ethereum’s market capitalization. Cumulative net inflows stood at approximately $11.21 billion, according to SoSoValue data.
MSSE’s launch expands regulated access to ETH for US investors through brokerage and retirement accounts. Its 0.14% expense ratio also increases fee competition among existing Ethereum funds.
ETF inflows alone do not prove that institutions caused the full price move. However, positive flows arrived as ETH tested a major support area, providing additional spot demand when liquidity was relatively thin.
Short liquidations accelerate Ethereum’s bounce
Derivative positioning added momentum to the recovery. Ethereum short liquidations reached $37.68 million over 24 hours, slightly exceeding the $36.66 million recorded for leveraged long positions.
The largest single liquidation was a $4.74 million ETH-USDT position on Binance, according to CoinGlass data. Forced closures of short positions require exchanges to buy back contracts, which can accelerate an existing price recovery.
The supplied 24-hour liquidation heatmap shows the strongest nearby overhead concentration around $1,938–$1,943. Additional liquidity rests near $1,955–$1,960.
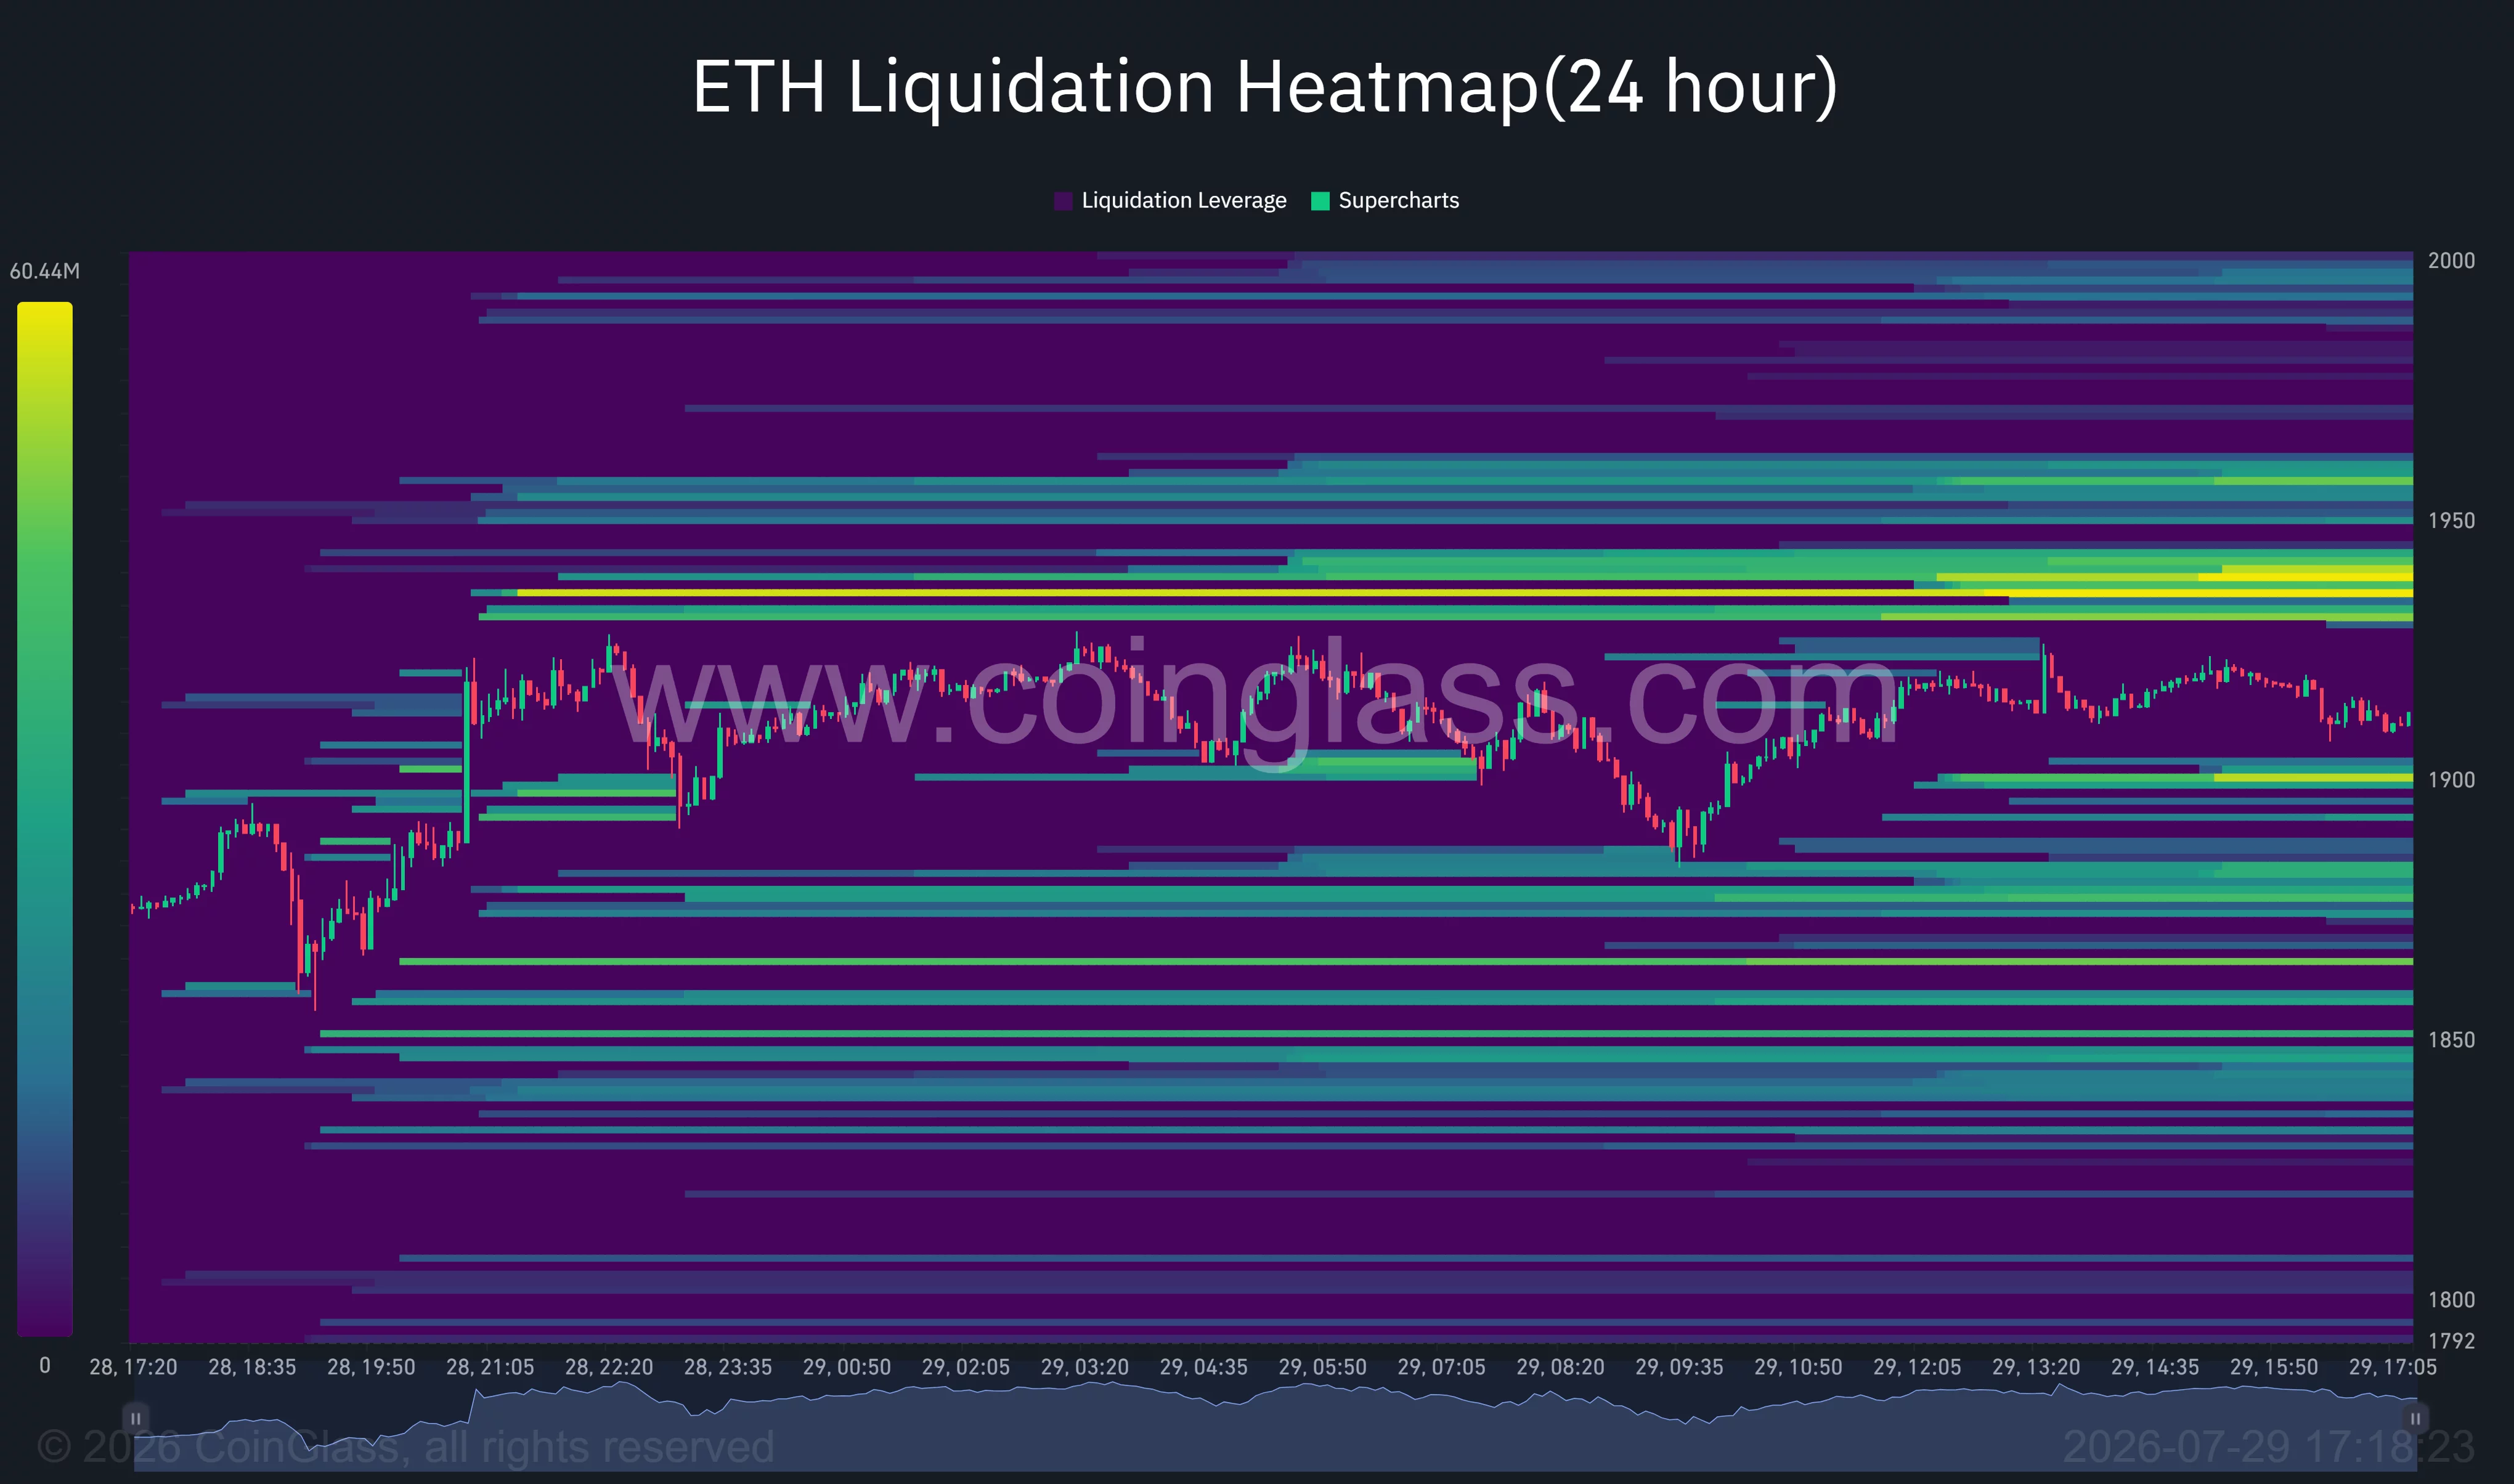
Ethereum liquidation heatmap | Source:
CoinGlassThese clusters may attract price if ETH maintains support above $1,900. A move through $1,960 could then expose the $1,970 Bollinger Band resistance and the $2,000 psychological threshold.
On the downside, leveraged positions are concentrated near $1,895–$1,900 and between approximately $1,870 and $1,885. Losing $1,900 could therefore trigger another sweep toward the lower part of the 4-hour channel.
Ethereum charts point toward $1,970 resistance
The 4-hour chart places Ethereum inside an ascending parallel channel that has guided price since early July. ETH recently tested the channel’s lower boundary near $1,880 before recovering toward its midpoint.
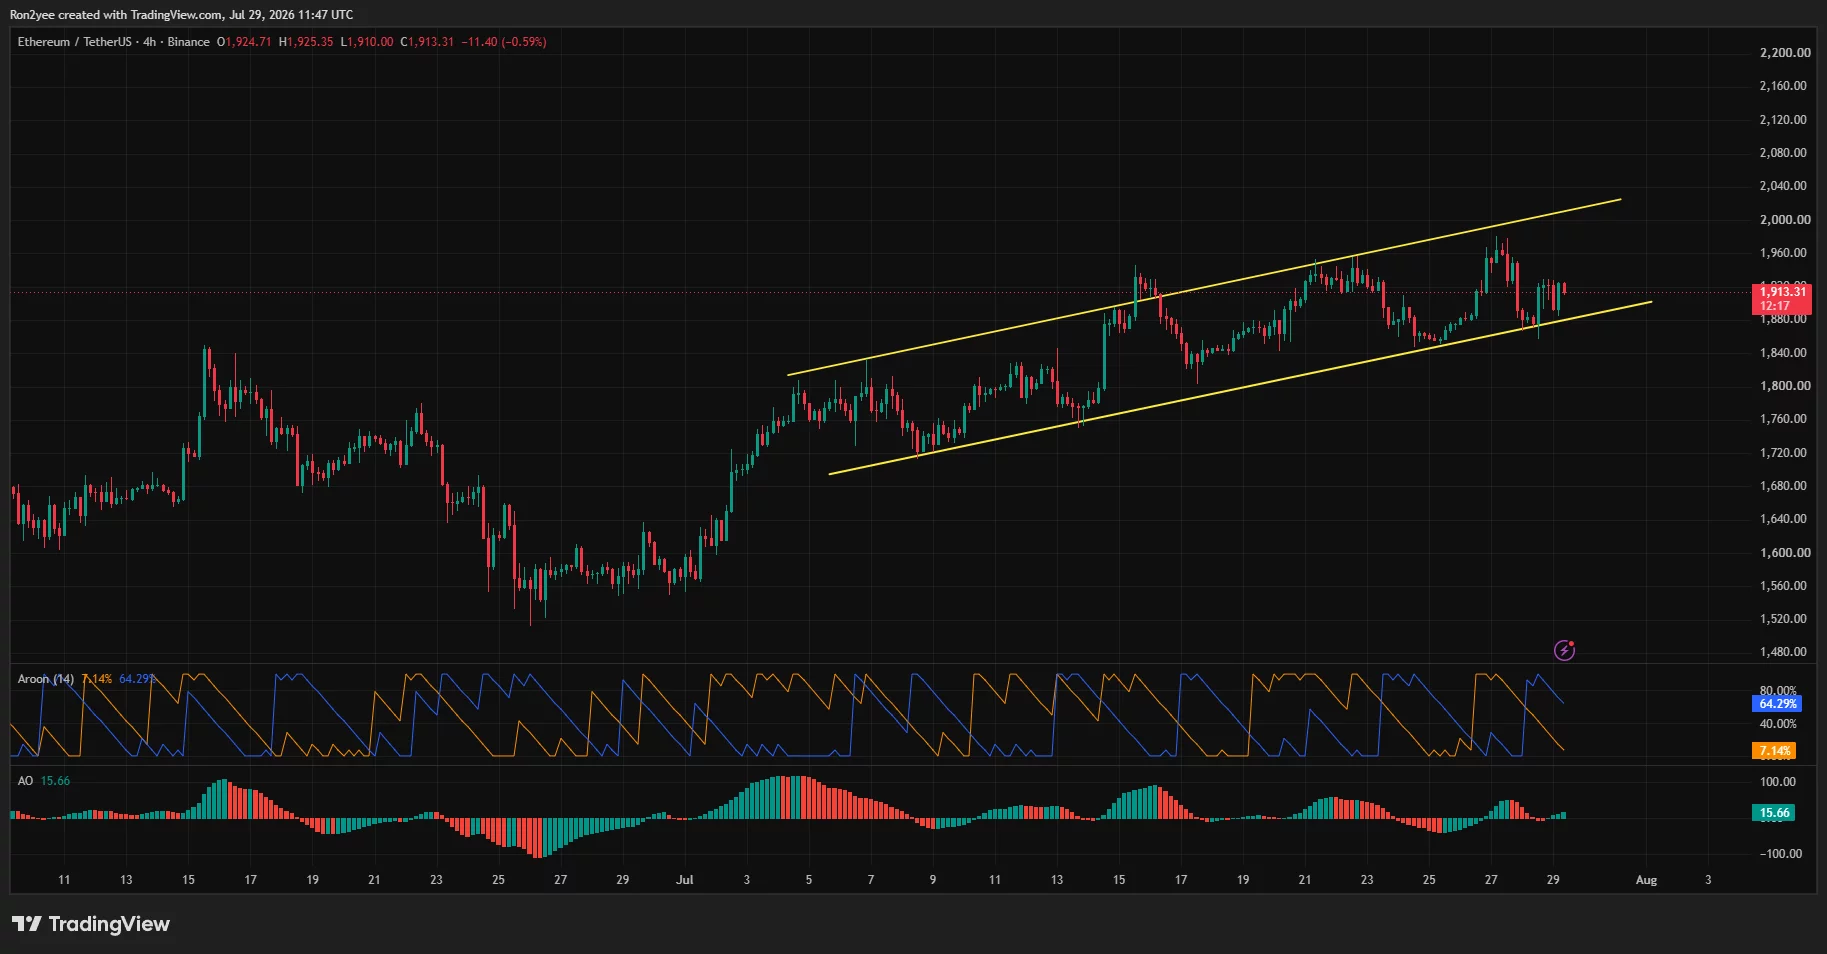
Ethereum price is trading within an ascending parallel channel pattern on the 4-hour chart — July 29 | Source:
crypto.newsThe Aroon Up indicator stands at 64.29%, compared with an Aroon Down reading of 7.14%. That difference suggests the recent bullish trend retains control despite ETH’s failure to hold its July 27 high near $1,970.
The Awesome Oscillator also remains positive at 15.66. Its green histogram bars show that short-term momentum has begun to improve following the latest pullback.
A close above $1,940 would clear the first major liquidation zone. Bulls would then need to break $1,970 and the upper Bollinger Band to open a test of $2,000. The ascending channel’s upper boundary could provide further resistance between $2,000 and $2,030.
Failure to hold $1,880 would weaken the channel structure. Below that level, the daily Bollinger midpoint at $1,874 becomes the first defense, followed by $1,800 and the lower band near $1,775.
Analysts see $1,800 as the critical floor
Crypto analyst Michaël van de Poppe identified $1,800 as the level Ethereum must preserve for the recovery to continue.
“I’d preferably see it hold above $1,800. If that’s the case, then it’s a matter of time until we’re going to see numbers that are north of $2,000.”
Daan Crypto Trades also noted that ETH had broken above its downtrend channel, daily 200-period moving averages, and bull market support band against Bitcoin. He said the ETH/BTC structure has remained bullish since June, although further altcoin gains still depend on Bitcoin holding its support.
The immediate macro test will come from the Federal Reserve. Markets largely expect the central bank to keep its target range at 3.50%–3.75%, but uncertainty over a possible quarter-point increase has risen. Notably, policymakers remain divided as they balance elevated inflation against easing energy prices.
A hold accompanied by a less hawkish statement could support ETH’s attempt to clear $1,970. A surprise increase or firm warning about future tightening would raise the risk of another decline toward $1,880 or $1,800.
Disclosure: This article does not represent investment advice. The content and materials featured on this page are for educational purposes only.
Read more: Can Bitcoin price break $65K after the Fed decision?