After several weeks marked by high volatility, Ethereum shows signs of recovery that revive investors’ expectations. The second most important cryptocurrency has rebounded from its low record
After several weeks marked by high volatility, Ethereum shows signs of recovery that revive investors’ expectations. The second most important cryptocurrency has rebounded from its low recorded in June and again attracts analysts’ attention. Several technical indicators and the growing interest of institutional players support a favorable short-term scenario. However, some signals still call for caution, as the market remains divided between the prospect of a new rise and the risk of a temporary pullback.
In brief
- Ethereum has rebounded 17% from its June low and is currently trading around 1,750 dollars.
- Several analysts believe that breaking current resistances could pave the way back to 2,000 dollars, or even 2,500 dollars.
- Ethereum spot ETFs have recorded their longest streak of increases since April, supported by a renewed interest from institutional investors.
- Despite this positive momentum, an RSI at 70 places Ethereum in overbought territory, raising the risk of a short-term correction.
Ethereum Consolidates Its Rebound Following Its June Low
The market shows signs of recovery after several weeks of weakness. Ethereum is now trading at levels closely watched by analysts, who observe several technical thresholds that could influence the next trend.
Here are the key figures reflecting the magnitude of this new development:
- Ether price at the time of writing: 1,745 dollars.
- 8% increase over one week.
- 17% rise since the June low.
- Resistance located between 1,820 and 1,850 dollars.
- Double bottom pattern formed below 1,800 dollars.
After testing its resistance zone, the asset was rejected. Despite this, several observers believe that staying above the current support is an encouraging signal for the future. Ted, an analyst active on X, considers that a sustained breakout of this resistance could pave the way for a rise to 2,000 dollars.
Meanwhile, Poseidon believes that the double bottom pattern formed by Ethereum is a configuration generally interpreted as a favorable signal for continuing the rebound. The analyst goes further by estimating that the price could reach 2,500 dollars before September if this momentum continues.
Start your crypto adventure safely with OKXThis link uses an affiliate program.Institutional Flows Strengthen the Bullish Outlook
The renewed interest from institutional investors accompanies this market improvement. Data shows that ETH-backed spot ETFs have recorded five consecutive days of gains. This is their longest positive streak since April, a factor closely watched by markets.
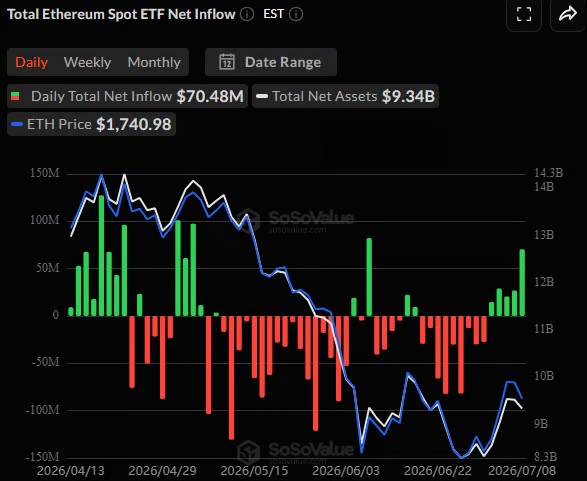 Ethereum spot ETFs register a new series of net inflows, signaling renewed interest from institutional investors as ETH price tries to consolidate its rebound. Source: SoSoValue
This dynamic reflects an increase in exposure from pension funds, hedge funds, and other institutional investors. As a result, several major asset managers have increased their ETH purchases to meet this demand. This movement supports Ethereum’s outlook, as these purchases can help strengthen the momentum observed over the past weeks.
Ali Martinez also reminds that the support around 1,580 dollars has already played a decisive role in previous cycles. He writes in a post on X:
Ethereum is once again testing the historical importance of its support at $1,580. Over the past three years, this level has established itself as the main demand zone, stopping corrections before triggering powerful rallies: +149% in October 2023, +203% in April 2025, and then a recent rebound towards the resistance at $1,800. As long as the $1,580 threshold is preserved, the bullish outlook remains intact and a similar scenario is entirely plausible.
Ali Martinez, analyst. Source: X / @alicharts
According to him, this level had stopped significant corrections before supporting rises of 149% in 2023 and 203% the following year. These precedents feed expectations of a new upward phase.
Technical Indicators Still Call for Caution
Despite this more favorable context, several elements call for vigilance. The Ethereum relative strength index (RSI) has reached the threshold of 70. In technical analysis, this level generally corresponds to an overbought situation, which can trigger a short-term correction.
The RSI moves on a scale from 0 to 100. Levels below 30 are usually associated with rebound opportunities, while levels near 70 may announce a market breathing phase. This reading does not necessarily indicate a lasting reversal but highlights a risk of additional volatility.
Some analysts argue for a more cautious scenario. KALEO believes that Ethereum could still experience a dip to 1,000 dollars before starting a much more marked upward movement. According to this hypothesis, this correction phase would precede a potential return to 5,000 dollars in the longer term.
The market thus remains divided between favorable technical prospects and short-term caution signals. If Ethereum maintains its key support levels and benefits from continued institutional flows, the upcoming sessions will confirm whether the $2,000 target can be reached or if a new consolidation phase is required before a more sustainable recovery.