Ethereum trades near $2,493 as Crypto Tony targets $2,530 resistance, with further barriers at 2,560–2,600. ETH’s four-hour RSI rises to 35.12 and MACD histogram turns positive at 2.73, altho
- Ethereum trades near $2,493 as Crypto Tony targets $2,530 resistance, with further barriers at 2,560–2,600.
- ETH’s four-hour RSI rises to 35.12 and MACD histogram turns positive at 2.73, although both MACD lines remain below zero.
- Crypto Patel projects Ethereum could reach $14,000 in Wave 3 and $50,000 in Wave 5, based on his long-term Elliott Wave analysis.
Ethereum has rebounded toward $2,493 after falling from nearly $2,700 in early October, with analysts Crypto Patel and Crypto Tony outlining different price scenarios. Crypto Tony expects a possible move toward $2,530, while Crypto Patel’s long-term Elliott Wave analysis identifies $50,000 as a potential fifth-wave target.
Crypto Tony Eyes Ethereum’s $2,530 Supply Zone
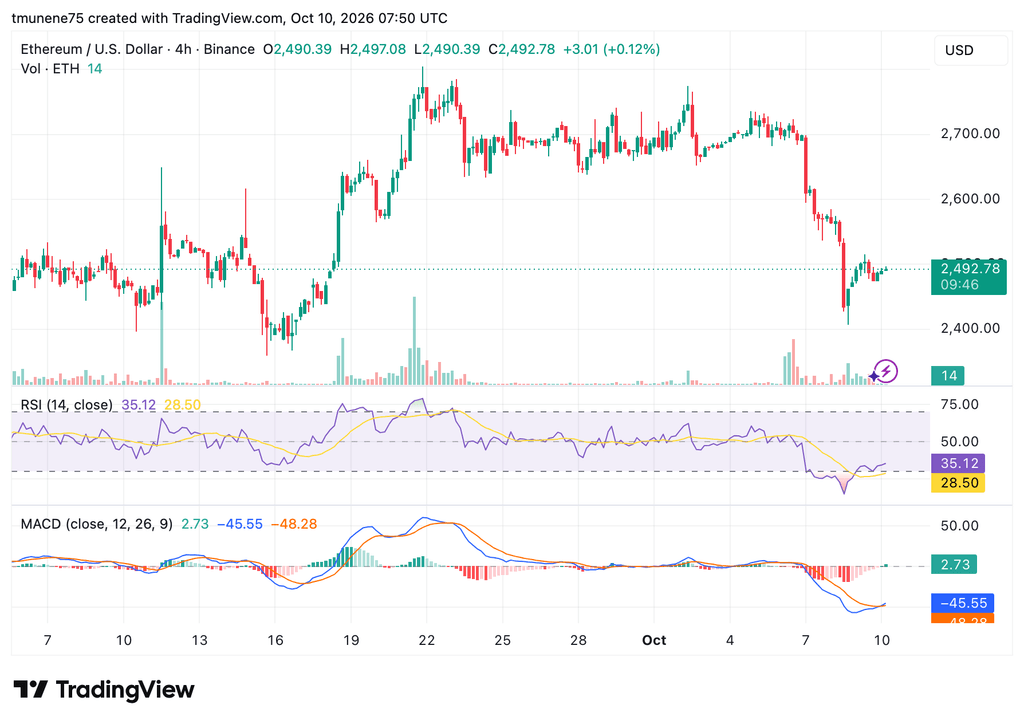
Ethereum traded at $2,492.78 on Oct. 10, 2026, gaining 0.12% on the latest four-hour candle. However, the broader short-term trend remains bearish after consecutive declines between Oct. 7 and Oct. 9.
ETH previously climbed from approximately $2,380 on Sept. 16 to nearly $2,800 on Sept. 21–22. It then consolidated between $2,650 and $2,720 before sellers pushed prices toward $2,430.
https://twitter.com/CryptoTony__/status/2108818060375433248?s=20
Crypto Tony expects ETH to move around its current range before attempting to reach the supply zone near $2,530. That level represents immediate resistance, followed by 2,560–2,600. Support remains around 2,450–2,430, with another potential downside test near $2,400 if resistance holds.
ETH Indicators Show Bearish Momentum Easing
Ethereum’s four-hour Relative Strength Index is at 35.12, above its signal average of 28.50. Although the RSI remains below the neutral 50 level, it has recovered from readings near or below 30.
Source:
TradingView
The Moving Average Convergence Divergence indicator also shows a modest improvement. Its MACD line is at -45.55, compared with -48.28 for the signal line, producing a positive histogram reading of 2.73.
Both lines remain below zero, however, indicating that the broader bearish structure persists. A break above $2,530 could open a move toward 2,560–2,600, while rejection could expose support near $2,450 and $2,400.
Crypto Patel Maps Long-Term Ethereum Targets
While Crypto Tony focuses on the immediate price structure, Crypto Patel outlined a longer-term scenario based on Ethereum’s ascending channel and macro Elliott Wave pattern.
Patel identified 1,000–1,600 as major historical support and 4,500–5,000 as previous cycle resistance. His projected Wave 3 extension target stands at $14,000, while the potential Wave 5 target reaches $50,000.
These levels represent Patel’s long-term projections rather than confirmed price outcomes. His analysis places the potential fifth-wave expansion within Ethereum’s broader ascending-channel structure.