Ethereum volatility index is once again moving into focus as traders assess whether Ethereum may be nearing another decisive market phase. The latest compression in volatility has prompted co
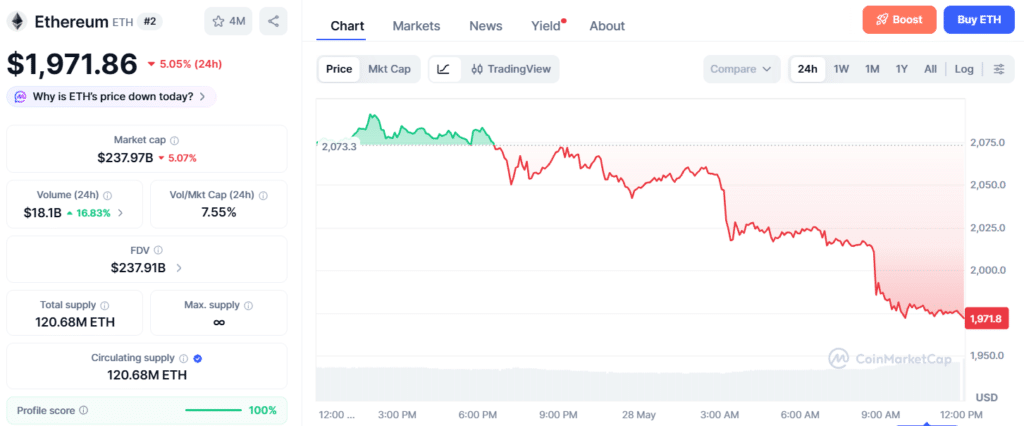
Ethereum volatility index is once again moving into focus as traders assess whether Ethereum may be nearing another decisive market phase. The latest compression in volatility has prompted comparisons with previous accumulation periods that later produced strong directional price moves for ETH. Ethereum has largely held above the $2,000 range since May 2025, although ETH is currently trading around $1,972.19 after declining 5.03% over the last 24 hours, reflecting continued market uncertainty as volatility indicators point toward a possible breakout setup.
Amberdata data showed the Ethereum volatility index at 48, down from the January 2024 low of 45. During the previous cycle, ETH rallied from $2,230 to $4,170 within nearly two and a half months as volatility expanded toward the 73 level. Analysts said the pattern highlights how extended periods of compressed volatility can sometimes precede major price expansion in crypto markets.
Current conditions, however, remain mixed. Ethereum is still down nearly 30% on a year-to-date basis, while the ETH/BTC ratio continues trading near fresh lows. Broader macroeconomic uncertainty, weaker speculative appetite, and growing competition from alternative blockchain ecosystems are also shaping investor sentiment.
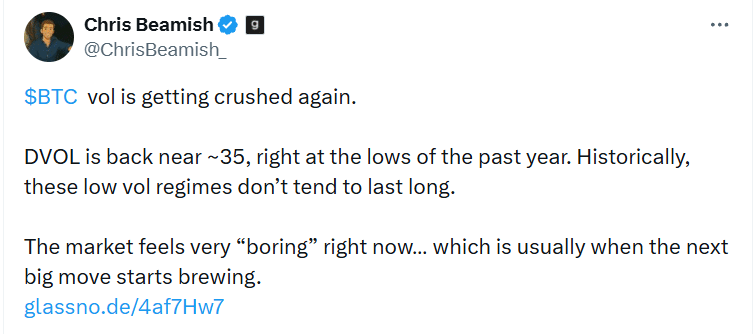
Amberdata’s VI stands at 48, while Historical Volatility on the 10-week average remains at 33.19. Glassnode analyst Chris Beamish stated BTC DVOL had returned near 35, matching lows seen during the previous low-volatility phase. Traders are also closely monitoring liquidity concentration around the $2,000 to $2,300 range, where derivatives positioning remains elevated despite ETH currently trading near $1,972.19.
What Does Ethereum Volatility Index Reveal About Current Market Conditions?
The Ethereum volatility index measures expected price fluctuations in ETH markets and is commonly used to identify periods of accumulation or potential breakout setups. Lower readings generally reflect weaker speculative activity and calmer trading conditions. Amberdata data showed the Ethereum volatility index falling below 50 for the first time since early 2024.
Ethereum Volatility Index Nears Multi-Year Lows as Traders Watch $2,200 Breakout Level 4
Analysts tracking previous cycles said similar compression phases historically appeared before major volatility expansion. However, compressed volatility does not guarantee a bullish outcome. In several previous market phases, low-volatility conditions resulted in extended sideways trading when liquidity remained weak and macroeconomic risks intensified.
The Ethereum volatility index has therefore become a widely watched market indicator rather than a standalone bullish signal. Traders said it should be evaluated alongside derivatives positioning, exchange flows, trading activity, and broader macroeconomic conditions before drawing directional conclusions.
Why Is The $2,200 Level Becoming A Key Market Trigger?
Technical analysts continue monitoring the $2,200 level because it aligns with Ethereum’s middle Bollinger Band on the weekly timeframe. The middle Bollinger Band is often viewed as a trend confirmation level and acts as a major resistance or support zone during market transitions. The lower Bollinger Band tightened significantly through 2025 and into 2026, reflecting some of the lowest volatility conditions recorded during that period.
Historical Volatility, smoothed using a 10-week average, currently stands at 33.19. Analysts say a sustained weekly close above $2,200, coupled with materially higher spot volume, would strengthen the case for a structural market shift. Without stronger confirmation through volume and liquidity expansion, ETH could remain range-bound near current levels.
Traders are also watching derivatives activity around the $2,000 to $2,300 range. Funding rate trends, put-to-call positioning, and open interest concentration are being monitored closely because sudden volatility expansion could trigger rapid liquidations in either direction, especially with ETH currently trading near $1,972.19.
Could Ethereum Repeat The 2024 Rally Structure?
Some traders believe current conditions resemble the structure that preceded Ethereum’s 2024 rally from $2,230 to $4,170. During that period, volatility compressed sharply before liquidity returned and price momentum accelerated. Glassnode analyst Chris Beamish stated BTC DVOL had returned near 35, matching lows recorded during earlier accumulation phases.
Analysts said synchronized volatility compression across Bitcoin and Ethereum could indicate that the broader crypto market may be approaching another expansion cycle. However, compressed volatility has sometimes preceded extended sideways ranges rather than immediate rallies, particularly when liquidity remained weak.
Analysts cautioned that historical setups are informative but not definitive indicators of future price action. Macro conditions also continue influencing crypto market direction. Analysts noted that volatility across digital assets between 2024 and 2026 remained highly sensitive to inflation data, interest rate expectations, and broader liquidity conditions.
A sustained improvement in macro liquidity could support upside momentum, while tighter financial conditions may trigger renewed downside volatility. The Ethereum volatility index remains central to market discussions because previous rallies emerged after similar periods of suppressed volatility.
Ethereum Volatility Index Nears Multi-Year Lows as Traders Watch $2,200 Breakout Level 5
What Risks Continue To Pressure Ethereum?
Ethereum continues facing stronger competition from alternative blockchain ecosystems and AI-focused crypto narratives. Analysts said speculative capital rotation toward AI-related tokens reduced inflows into ETH markets during several periods this year.
Some ecosystem revenue and decentralized finance activity have also shifted toward chains such as Solana and Hyperliquid. Market observers pointed to growing Layer-2 activity and changing revenue flows as additional variables influencing Ethereum’s broader market position. The bearish debate intensified after Bankless co-founder David Hoffman stated on May 27, 2026 that he had sold all of his ETH holdings.
Hoffman said Ethereum succeeded as a network but failed as money despite building his business and community around the ecosystem. Ethereum’s continued weakness against Bitcoin also remains a concern for traders. Analysts said deterioration in the ETH/BTC ratio historically reflected weaker institutional positioning toward ETH relative to Bitcoin.
Several downside scenarios are also being monitored closely. A hawkish inflation surprise or a sharp deterioration in risk-asset liquidity could trigger downside volatility expansion and weaken bullish setups. Sustained net inflows toward exchanges may signal distribution activity and increase the risk of declines below $1,900.
Traders also warned that widening negative funding rates combined with rising put-buying activity could accelerate downside liquidations if ETH fails to reclaim resistance near the middle Bollinger Band, with ETH currently trading around $1,972.19. The Ethereum volatility index may indicate accumulation conditions, but traders said bearish risks remain active until stronger demand and broader market participation return.
What Signals Are Traders Monitoring Before Entering Positions?
Many market participants continue waiting for stronger confirmation before positioning aggressively around Ethereum’s current range. Analysts said volatility indicators alone remain insufficient without support from liquidity, derivatives positioning, and trading activity.
Bullish confirmation signals being monitored include a weekly close above $2,200, stronger spot trading volume, declining exchange balances, positive funding rates, and improving call-side activity in options markets. Bearish warning signs include rejection near the middle Bollinger Band with stronger sell pressure, rising exchange inflows, persistent negative funding rates, and a breakdown below the $1,900 support range on a weekly closing basis.
Traders are also monitoring exchange balance trends, active address activity, decentralized finance participation, and Layer-2 adoption metrics to assess whether accumulation or distribution conditions are strengthening. The Ethereum volatility index remains one of the market’s most closely watched indicators, although analysts continue stressing the importance of combining volatility signals with broader technical and on-chain analysis.
Can Ethereum Still Return To $4,000?
The debate around Ethereum’s path back toward $4,000 remains divided across the market. Bullish traders argue that prolonged consolidation around the $2,000 range combined with historically low volatility could create conditions for another expansion phase if liquidity conditions improve.

Ethereum Volatility Index Nears Multi-Year Lows as Traders Watch $2,200 Breakout Level 6
More cautious analysts believe Ethereum first needs to establish higher highs, stronger volume trends, healthier derivatives positioning, and improving market participation before a sustainable rally can develop. A confirmed breakout above $2,200 could improve sentiment, while failure to maintain support near the $1,900 range may increase downside pressure, especially with ETH currently trading around $1,972.19.
Some analysts also pointed to the growing influence of Layer-2 ecosystems and changing capital flows across decentralized finance markets as variables that could alter previous market cycle behavior. The Ethereum volatility index continues to reflect unusually calm trading conditions.
However, analysts stressed that historical volatility patterns should not be treated as guarantees, particularly during periods of uncertain macroeconomic conditions and changing investor sentiment across the digital asset sector.
Conclusion
Ethereum volatility index readings near multi-year lows have intensified speculation around Ethereum’s next major market phase. Previous volatility contractions were followed by strong price expansion, including ETH’s move from $2,230 to $4,170 during 2024. Current market conditions, however, remain more complicated. Ethereum continues facing pressure from weaker ETH/BTC performance, growing competition from rival blockchain ecosystems, and cautious macro sentiment across global risk assets.
For now, traders remain focused on whether Ethereum can secure a sustained move above $2,200 while stabilizing around the $2,000 range after recently trading near $1,972.19. Analysts said low volatility increases the probability of a sharp market move, though confirmation will depend on price action, liquidity conditions, derivatives positioning, and broader investor participation.
Disclaimer: This analysis is for informational purposes only and does not constitute investment advice. Historical volatility patterns may not repeat, and leveraged trading carries elevated risk during periods of compressed market activity.
Glossary
Ethereum Volatility Index: Measure of expected ETH price movement.
Bollinger Bands: Tool showing price volatility and trend ranges.
ETH/BTC Ratio: Ethereum’s strength compared to Bitcoin.
Open Interest: Total active futures and options positions.
Funding Rate: Payment balance between long and short traders.
Frequently Asked Questions About Ethereum Volatility Index
Why is Ethereum volatility falling important?
Falling volatility can signal a possible accumulation phase in the ETH market.
What is the current Ethereum volatility index level?
The Ethereum volatility index recently fell below the 50 level.
Why are derivatives traders important for ETH price movement?
Derivatives trading can trigger faster and larger ETH price swings.
What are traders monitoring right now in Ethereum markets?
Traders are closely watching ETH volatility, volume, and the $2,200 level.
Can Ethereum still rally above $4,000?
Some analysts believe ETH could rise if volatility increases again.
Sources:
AMBCrypto
Kucoin