ETH approaches a potential third consecutive red quarter, a first in its trading history. Trading volume remains elevated despite ETH holding far below previous cycle highs. Historical data s
- ETH approaches a potential third consecutive red quarter, a first in its trading history.
- Trading volume remains elevated despite ETH holding far below previous cycle highs.
- Historical data shows strong recoveries often followed two consecutive losing quarters.
Ethereum Volume remains a central focus as Ethereum approaches a historic quarterly close. Market data shows persistent trading activity while ETH faces the possibility of recording three consecutive losing quarters for the first time.
Ethereum Nears Unprecedented Quarterly Streak
A recent post from Whale Factor drew attention to Ethereum's quarterly performance. The post noted ETH is on track for three consecutive red quarters. Such an outcome has never occurred in Ethereum's recorded market history.
https://twitter.com/WhaleFactor/status/2066051813074243807?s=20
CoinGlass data shows Ethereum declined 29.26% during Q1 2026. The asset then fell another 20.26% in Q2 2026. A negative Q3 close would extend the losing streak further.
Previous market cycles showed different outcomes after consecutive quarterly declines. Historical records indicate strong reversals followed earlier periods of sustained weakness. That pattern remains a key discussion point among traders.
The data highlights notable examples from past cycles.Ethereum bounced back in 2022 in the third quarter of the year due to the previous two challenging quarters. The same recovery came after a pair of losses in 2024.
Ethereum Volume Stays Active Despite Price Weakness
Ethereum volume data presents another important market signal. Trading activity remains elevated even as ETH trades well below prior highs. Market participation has not faded despite weaker price performance.
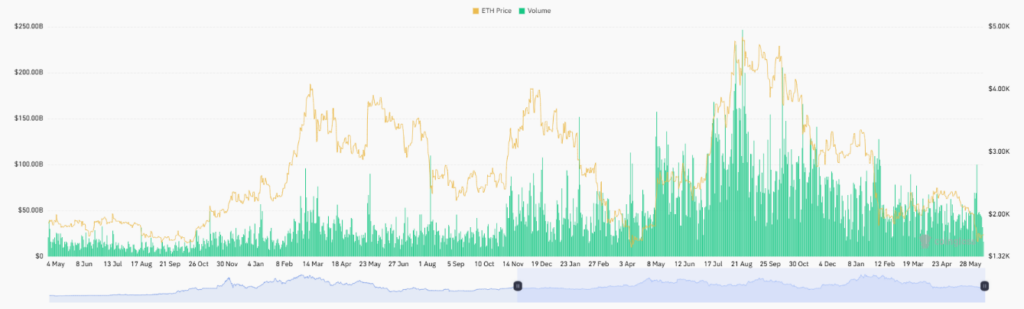
Source:
CoinglassThe volume chart shows expanding activity during previous rallies. The volume grew rapidly as ETH has continued to rise towards $4000-$5000. Rising participation often accompanied stronger market momentum.
The largest volume spikes appeared near cycle highs. Several trading sessions recorded activity approaching $200 billion. The periods were when markets were bull markets and aggressively positioning.

Ethereum began its long consolidation period after the peak. Price retreated while volume remained relatively strong. The pattern suggested continued engagement from both buyers and sellers.
Historical Trends Meet Current Market Conditions
Ethereum volume trends differ from earlier bear market periods. Activity remains steady rather than collapsing alongside price. Frequent volume spikes continue to appear across the chart.
Ethereum as of the time of writing trades near the lower end of its recent range. Yet volume levels indicate ongoing market interest. Participants continue transacting despite broader sentiment weakness.
Historical quarterly averages provide additional context. CoinGlass data shows Q3 and Q4 historically delivered positive average returns. Median returns for both quarters also remained above zero.
Market participants are now watching whether history repeats. Two consecutive red quarters previously preceded recoveries. The coming quarterly close may determine whether Ethereum follows that pattern again or establishes a new one.
The combination of persistent Ethereum volume and negative quarterly performance has created a closely watched setup. Traders are monitoring both metrics as Ethereum approaches a potentially historic milestone. Market attention remains fixed on whether sustained activity can support a reversal during the months ahead.
The post Ethereum Volume Signals Historic ETH Quarter Test appears on Coin Futura. Visit our website to read more interesting articles about cryptocurrency, blockchain technology, and digital assets.